
Charting in General
The charts can be an effective tool and teach you to trade with confidence if you know how to “read” and analyze them correctly. That’s a bold statement but once you finish this course, I you will understand why the charts contain all the information you need to trade. You will learn to get a “feel” for the charts and learn to “hear” what they are telling you. Sometimes they will even “shout” at you!
Trends
“The Trend Is Your Friend.” What this means is that the price may trend in one direction for a long time. You always want to trade with the trend. Usually if the long-term trend is down, you want to be short, and if the long-term trend is up, you want to be long.
There Are Three Types Of Trends
- The Major Trend
- The Minor Trend
- The Near Term Trend also called The Current Trend
The Major Trend: Charles Dow, the author of Dow Theory, said that the major trend could last a year or longer. However he was referring to stocks when he said this. When looking at a commodities chart, you could shorten that to six months. Currency markets tend to trend longer than other markets.
The Minor Trend: Most people look at the Minor Trend being between three weeks to three months.
The Current Trend: This is sometimes referred to as the Near Term Trend and should be looked at as the trend in the last up to three weeks.
When you look at charts, you will notice that in the Major Trend, you will see Minor Trends that could be opposite the Major Trend. Within the Minor Trend, you will see Near Term Trends that could be opposite the Minor Trend.
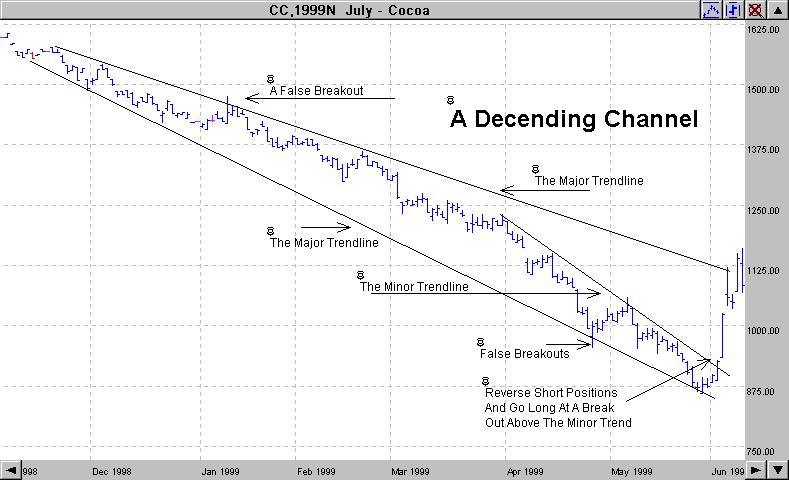
Look at the very long-term downtrend in Cocoa on the Daily chart below. It’s obvious that the Major Trend is down but you will also notice that several times the price rallied for a week or so during the downtrend. This is quite normal, as you will soon see.
The price was way up at the start of the contract, and then changed trend as the price began to drop. This downtrend started in November, and then hit “bottom” in May, and then headed back up.
Obviously, if you had caught this trend back in November, and stayed with it until June, you could have made a lot of money.
Learning to draw trend lines is important in learning to trade correctly. A standard way to look at what a trend is, you first need to define it. A downtrend, as shown on this chart, is a series of lower highs and lower lows. An uptrend is just the opposite, a series of higher highs and higher lows.
An uptrend can be intact until a previous support has been broken. In the case of a downtrend, a breakout above the trendline and the price closes above the trendline for more than two consecutive days is a good indicator that the trend might be broken. Of course the opposite holds true for an uptrend.
By drawing trendlines, you can see when the breakout of the downtrend occurs, and the price starts heading back up. Look again at the previous chart for July 1999 Cocoa. I’ve drawn the trendlines for you. It’s obvious when this trend ended and the price reversed direction. When the price reversed and went up, you would want to be out of all your short trades, and go long, or buy a contract. Remember, when you go short, you sell a contract, and when you go long, you buy a contract.
Drawing Trendlines
I like to draw my trendlines across the tops AND the bottom prices. I feel this gives me a better visual feel for what the trend is doing. You don’t have to draw both lines if you don’t want to.
In a downtrend, it’s important to draw a trendline across the highs, and across the lows in an uptrend. Look back at the Cocoa chart and you can see that I drew both lines on this chart.
Confirming The Trend – Getting Three Hits
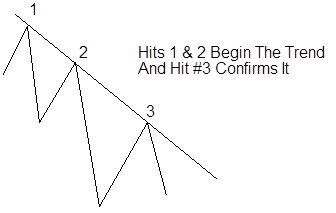
When you draw your trendlines, you must get three “hits” in order to confirm the trend. Let’s look at the following diagram to see what I mean.
As you can see, the first two times the price hit the top of the trendline, it started the downtrend. However it takes the price hitting the trendline the third time for the trend to be confirmed.
Of course the same holds true of an uptrend to be confirmed.
What Significance Does This Have?
Remember in school, we learned that a body in motion tends to stay in motion? The same holds true for trends. It takes a lot of energy or momentum to reverse a trend.
You might be wondering how to determine to strength of a trend. There are several ways I like to do this.
- Number of hits:
- How long has the trend been established
- Rate of Ascent or Descent
Number of hits: The more times the price touches or hits the trendline, the more valid the trend. This is just plain common sense again. Ten hits, is more important than three hits. Right? Of course it is. Look at how many times the trendline was hit on the Cocoa chart.
How long has the trend been established? A trend that is six months old is obviously stronger than a trend that is six weeks old; again, just common sense.
Rate of Ascent or Descent: One of my students is a pilot, and we were talking about this once. He used the analogy of how fast a plane is descending. A plane on a 10% descent is much easier to pull out of the dive than a plane that is on a 30% descent. So keep this in mind when you are looking at trends. Is the trendline on a nice steady slow descent or is it in a nose dive?
Redrawing the Trendlines
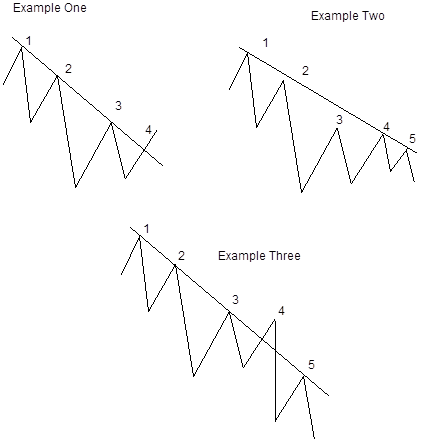
Sometimes “Old Man Trend” will try and fool you. Let’s use some common sense and see if we can stay on track. In the following diagram, in example one, you will notice that the prices kept hitting the trendline over and over, and then it suddenly broke out of the trend one day (point #4 in example one).
What do you do? Is the trend broken? Do you redraw the trend line? The following diagram, may help in your decision making process.
The way that I like to do it, is to wait until the fourth or fifth “hit” is made. In Example two below, the next hit would confirm that the trendline should be raised, and connected between points 1, 4 & 5.
On the other hand, if the price did not rise (example three), then I would continue the trendline as it was in example one, and would consider point #4 where it broke out of the trend, as a false breakout.
How to Tell If The Trend Is Actually Broken
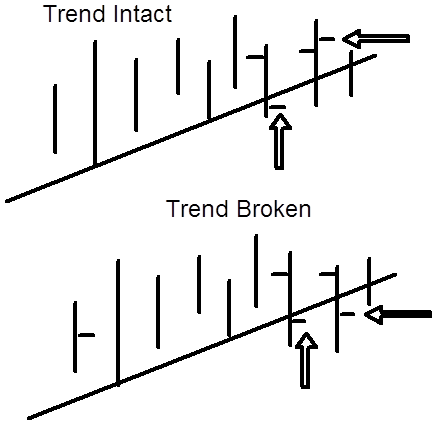
There is no absolute way except to just wait and see. One way that might help is to watch the closing price. If the closing price is beyond the trend line for two or more periods, then there’s a good chance the trend may be broken.
By period I’m referring to the time period of the chart the trendline is drawn on. If you are looking at a daily chart, then the trend would be broken after 2 daily closes. If your trendline is drawn on an intraday chart like a 1 hour chart then the trend is broken after 2 hourly closes, etc.
Look at the diagram to see what I mean.
In the above example, the top diagram shows you that the trend is still intact since the price did not close below the trendline for two consecutive periods.
The Bottom diagram shows the trend being broken, since the price did close below the trendline for two consecutive periods.
Hopefully, this will keep you out of some bad/false, trendline breakouts.
The Magnetic Trend Line
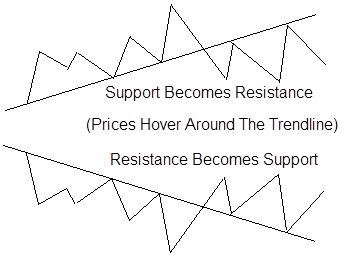
Many times you will see the trend change and the trendline will act as a magnet. The trend will reverse from up to down, or down to up. When it does, you will often see the price hover around the trendline again. In other words support becomes resistance, or resistance become support.
The prices tend to hover around the trendline, like it’s a magnet. Look at the following Diagram to see what I mean.
One way to profit by this is to use the trend line as support or resistance for entering trades or for placing your stops.
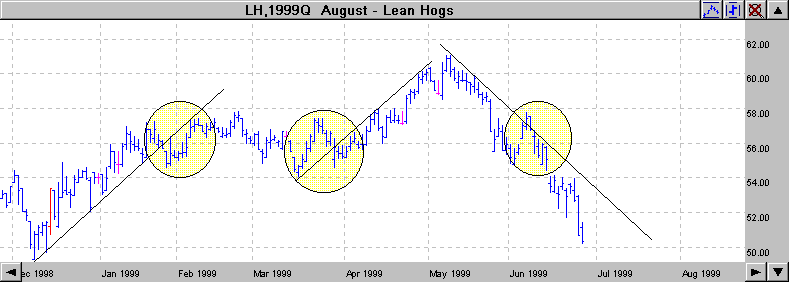
You can see that this happened three times on the following chart of Aug. 1999 Lean Hogs. Isn’t this interesting! So keep your old trendlines on the charts you draw, as they may act like a magnet and draw the prices to them. We will cover this later in more detail but check out the following chart.
The Fan Principal
As you have seen, prices will often bounce between trendlines. Let’s look at an uptrend diagram.
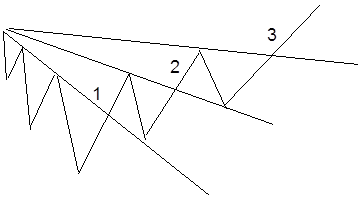
As we have discussed, prices will tend to bounce back and forth between these trendlines. Many chartists believe that in order for a trend to be reversed, the trendlines must be broken three times in order to confirm the trend reversal.
Look back on some of your own charts in the software to see how uncannily accurate it is.
In John Murphy’s Book, Technical Analysis of the Futures Markets (Highly recommended reading by the way), he talks about the importance of the number three.
(He says that the Fan Principal has three points, major bull and bear markets go through three phases, (Dow Theory & Elliott Wave Theory), there are three types of Gaps, there are Triple Tops & Triple Bottoms, Head & Shoulders that have three main peaks, three classes of trends that we talked about earlier, three trend directions (up, down and sideways), three types of triangles, and there are three principal sources of information, Price, Volume and Open Interest.)
I will discuss all of these things later in the course. I just find it very interesting and wanted to make sure you keep it in mind as well.
45 Degree Angles
W.D. Gann liked to use 45 degree angles with all his trendline projections. His theory was that most “true” trendlines, will angle at an almost perfect 45 degrees. If the angle is greater than, or less than that, then it won’t hold.
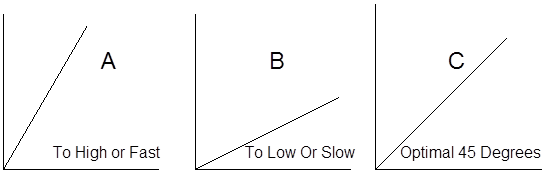
Look at the following chart to get an idea of what Mr. Gann was talking about.
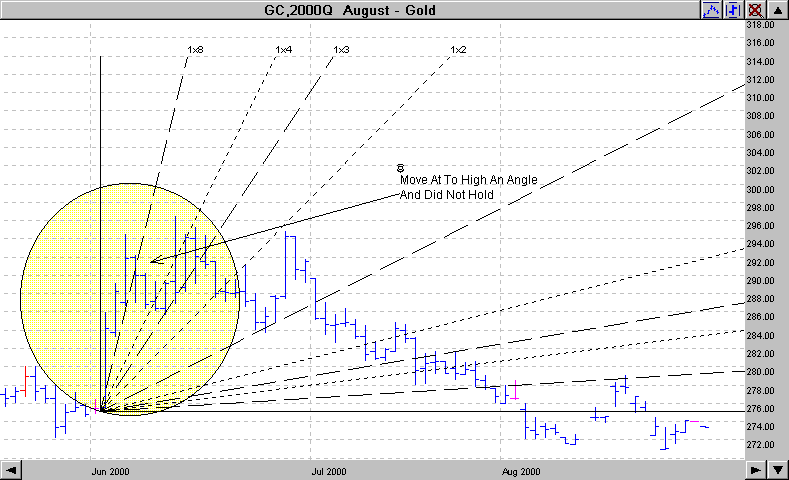
So when you see a trendline that is just too slow or too fast, in most cases, don’t trust it. See the trend at the beginning of this chart when it shot almost straight up? As you can see it did not hold. The down trend that started at the end of June was closer to a 45 degree angle and as you can see on the chart, so far it has lasted for several months.
It would be interesting to look this up and see what happened. Did the trend hold?
Remember this Chart? Look at the three lines I drew on it. As you can see all three of them were approximately a 45 degree angle and they all lasted for two to three months. Aren’t these charts interesting?