On the following pages, I have included 10 different study charts for you to study. These charts are from various commodities markets. It doesn’t matter if they are current or old charts as they are for study purposes only.
I have drawn some analysis on a few of them for you to get you started. I have also done them using my charting software to show you how easy it is to create things like Moving Averages, Trend Lines, RSI, etc.
All the charts were created using Gecko Software’s Track N Trade Pro. If you don’t have it, I strongly recommend you get it because not only is it cheap, but it will also save you time. The ability to rewind, forward, and play the charts will allow you to paper trade historical charts. Also, if you have this software let me know and I will send you the Chartbook containing the study charts in this lesson. That way you can paper trade them directly using the software.
On each chart, unless I did it for you, you need to look for EACH of the following items and draw them out on the chart. You might need to go on-line and look at the Weekly and Monthly charts too. So keep that in mind
In the last section of the course you will find the same charts except they have been extended out in time a few weeks to show you what the market actually did. This way, you can compare what your paper trades were to what the markets actually did.
Please don’t cheat yourself and look at the charts in the last lesson before doing these lesson charts. This is the most important lesson of the course, and it’s the best way to learn.
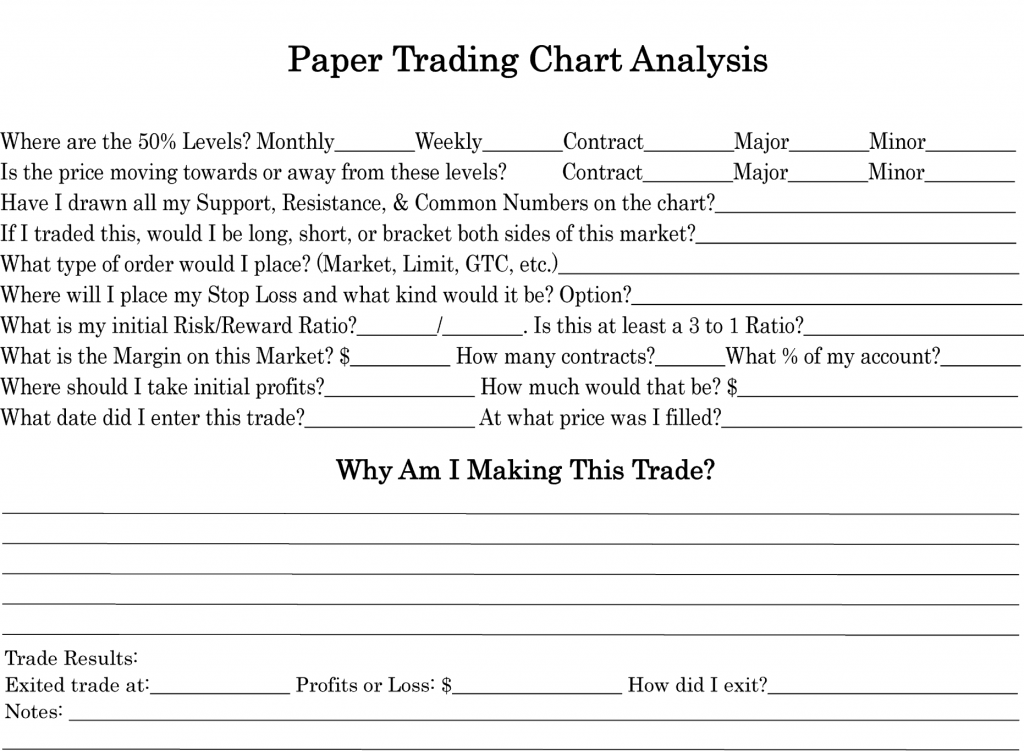
I would also use a trading journal template for each one of the study charts. This is your first lesson in paper trading. If you are going to be successful in trading real money, you must learn to paper trade and analyze charts properly. This is paramount to your success.
It’s ok if you don’t get all of them right. Even if you only get a couple of them right, congratulate yourself because you have succeeded in taking your first step in this fascinating journey into the future.
Learn what you did wrong as well as right, and you will improve with time and experience. I wish you the best on the charts!
Go to work!
Use the following worksheet to complete your analysis and the results of each opportunity. Click the link below for the pdf.
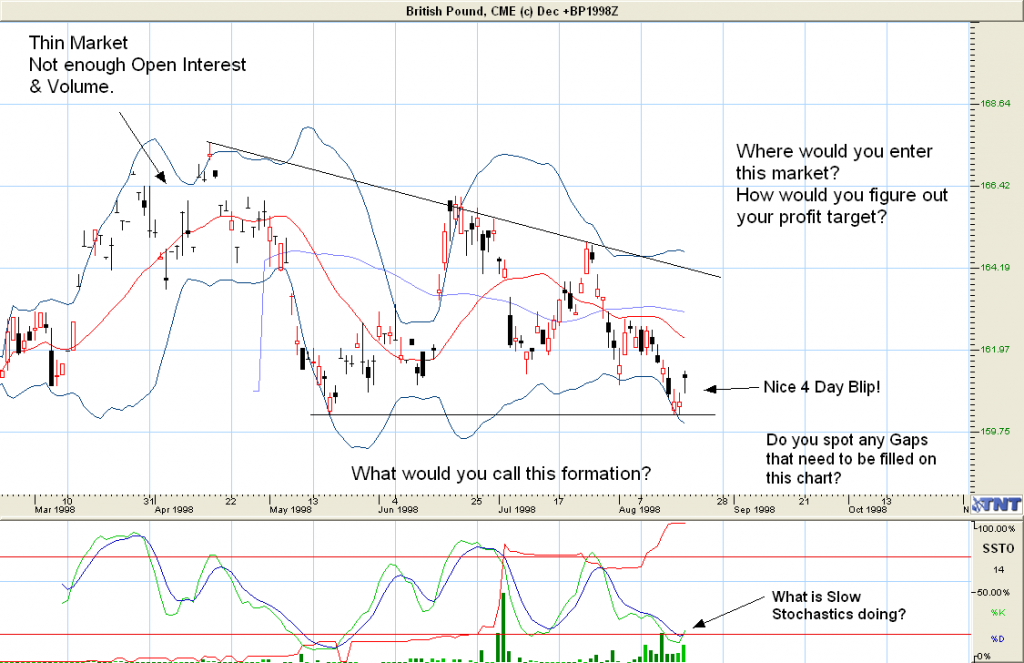
Opportunity 1: British Pound
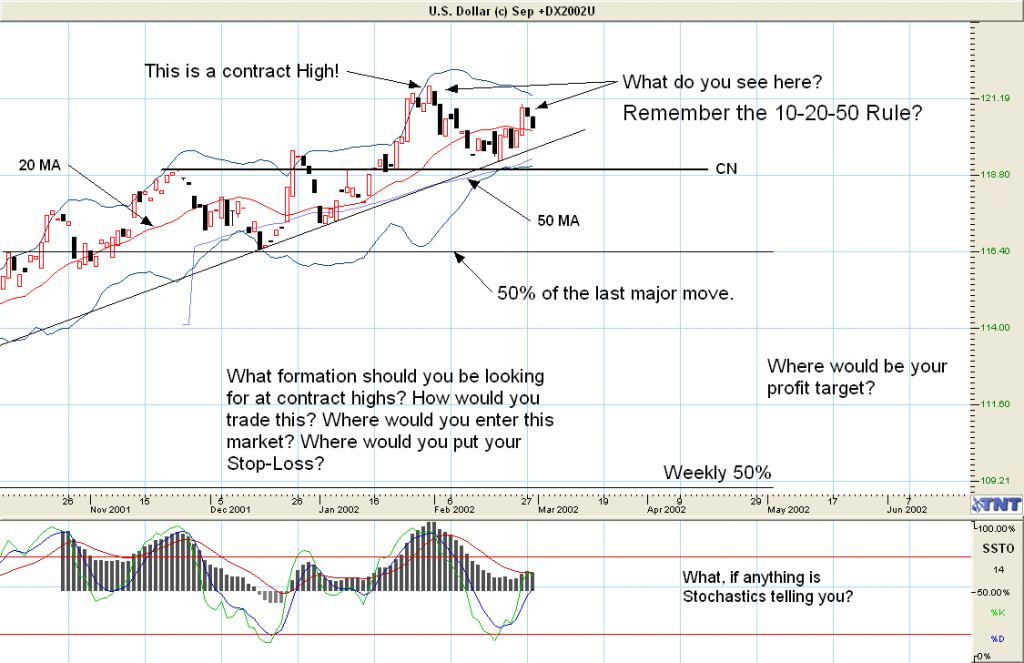
Opportunity 2: U.S. Dollar
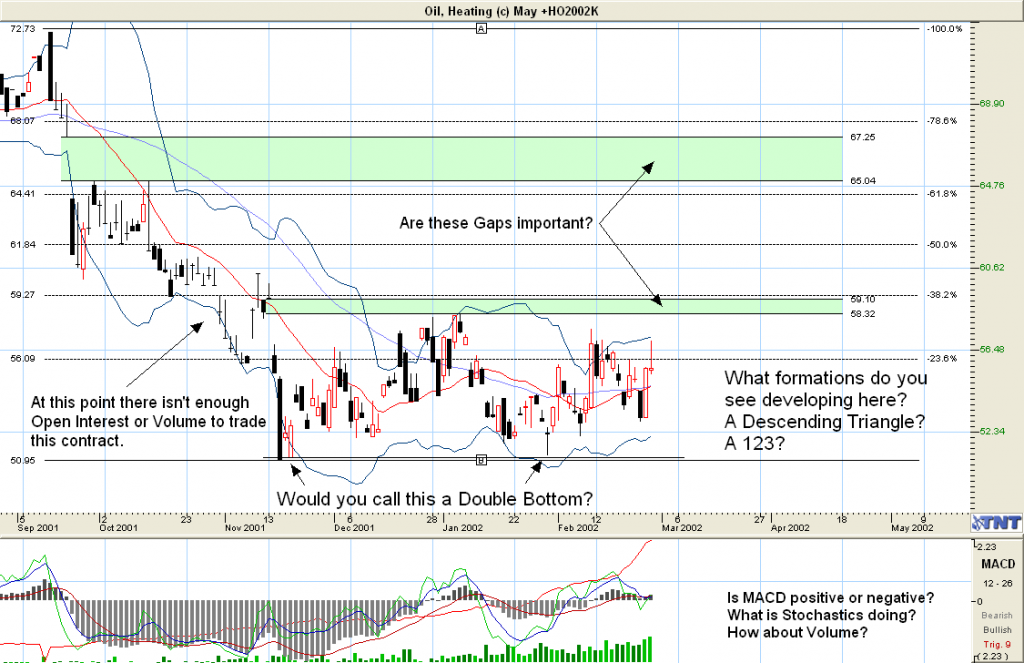
Opportunity 3: Heating Oil
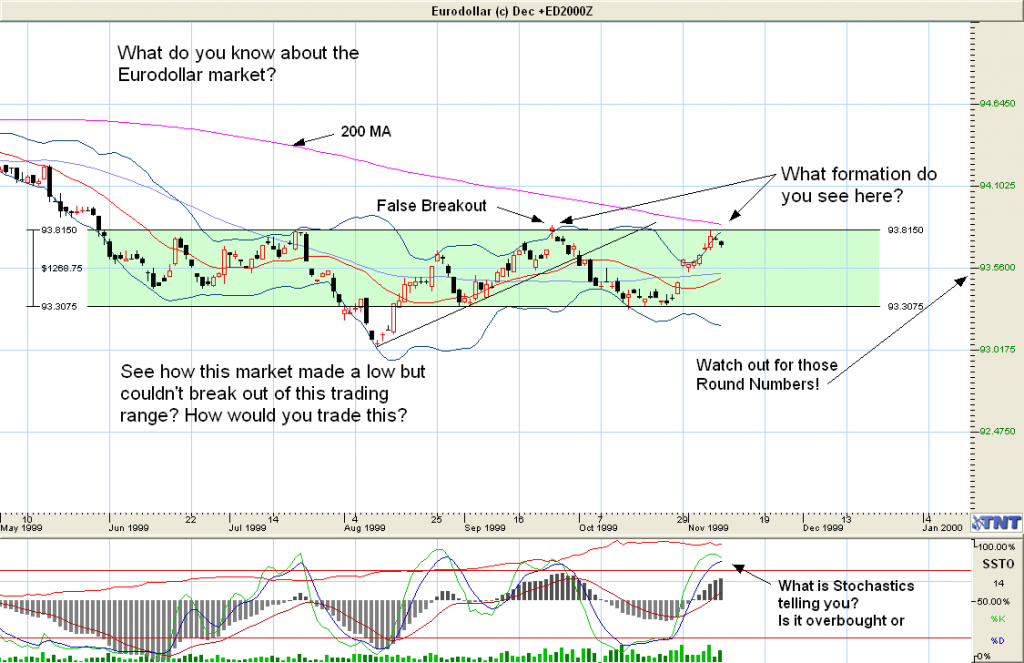
Opportunity 4: Eurodollar
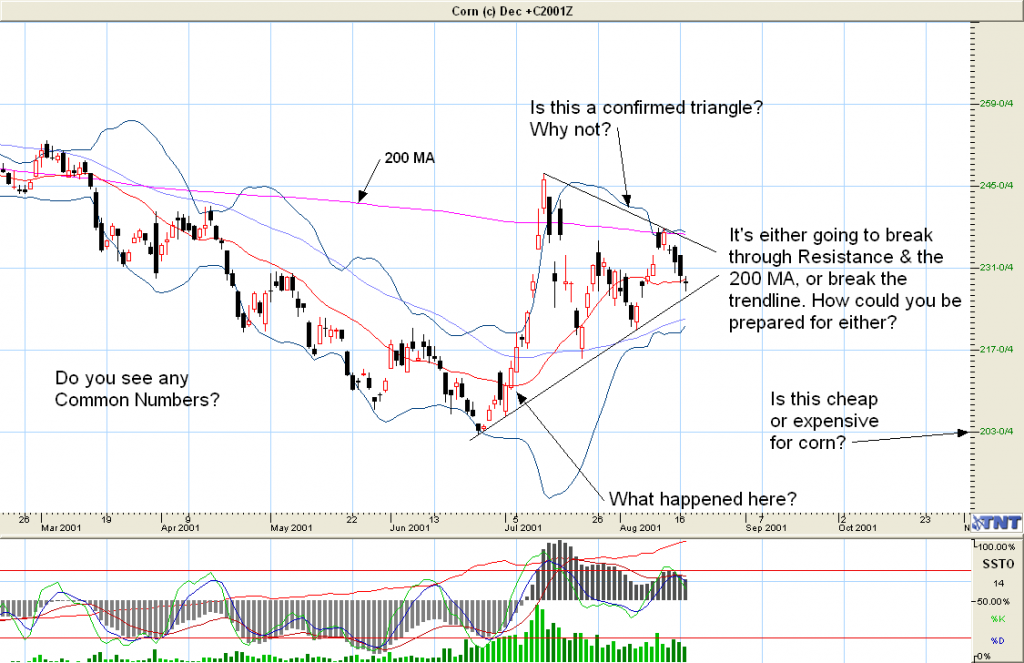
Opportunity 5: Corn
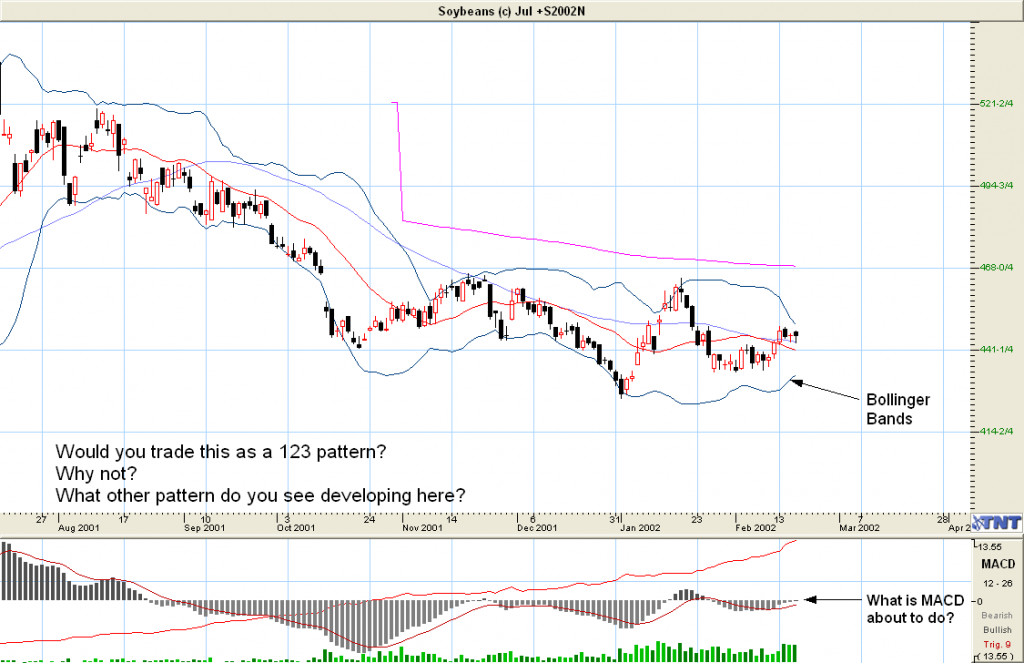
Opportunity 6: Soybeans
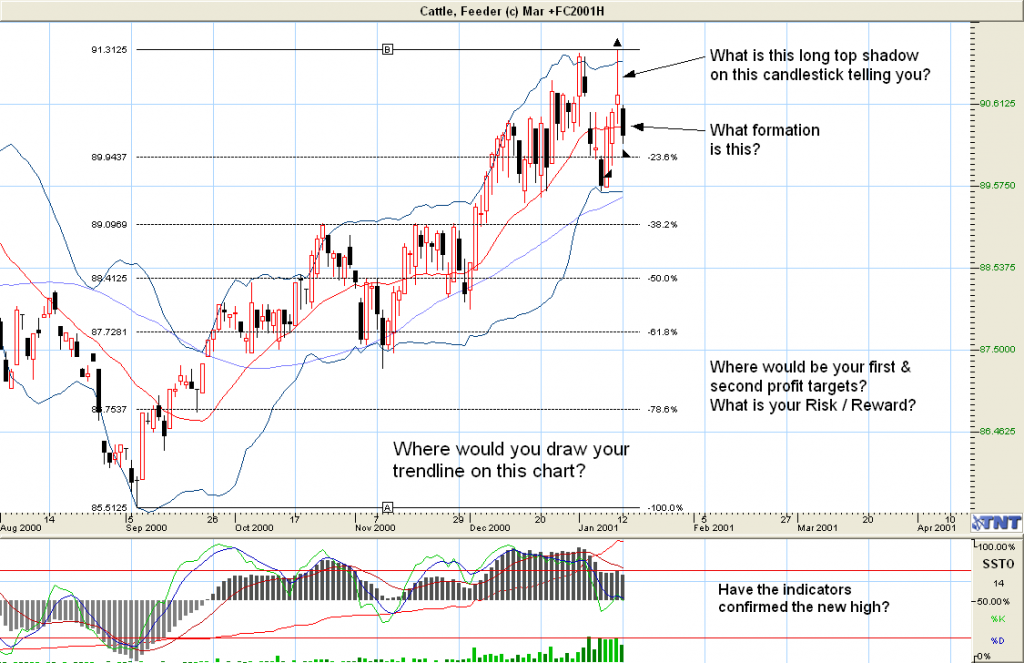
Opportunity 7: Feeder Cattle
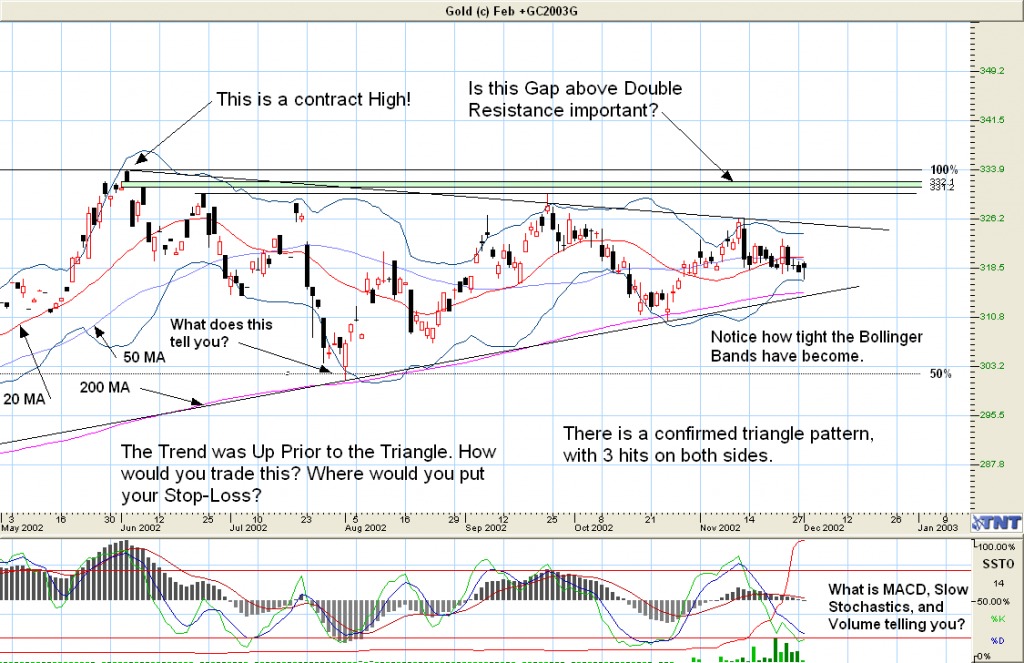
Opportunity 8: Gold
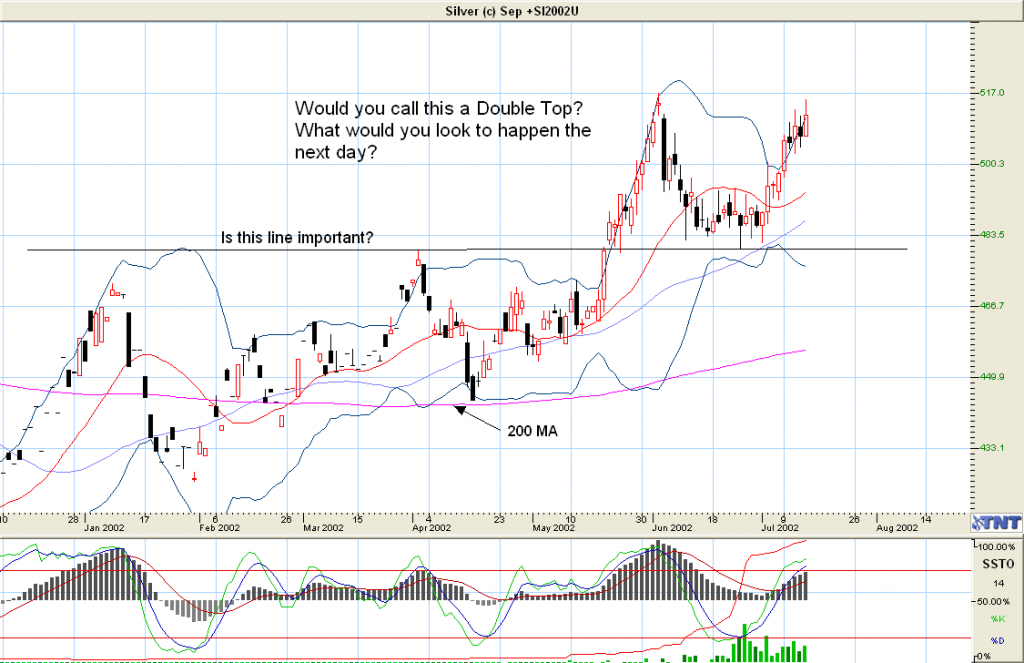
Opportunity 9: Silver
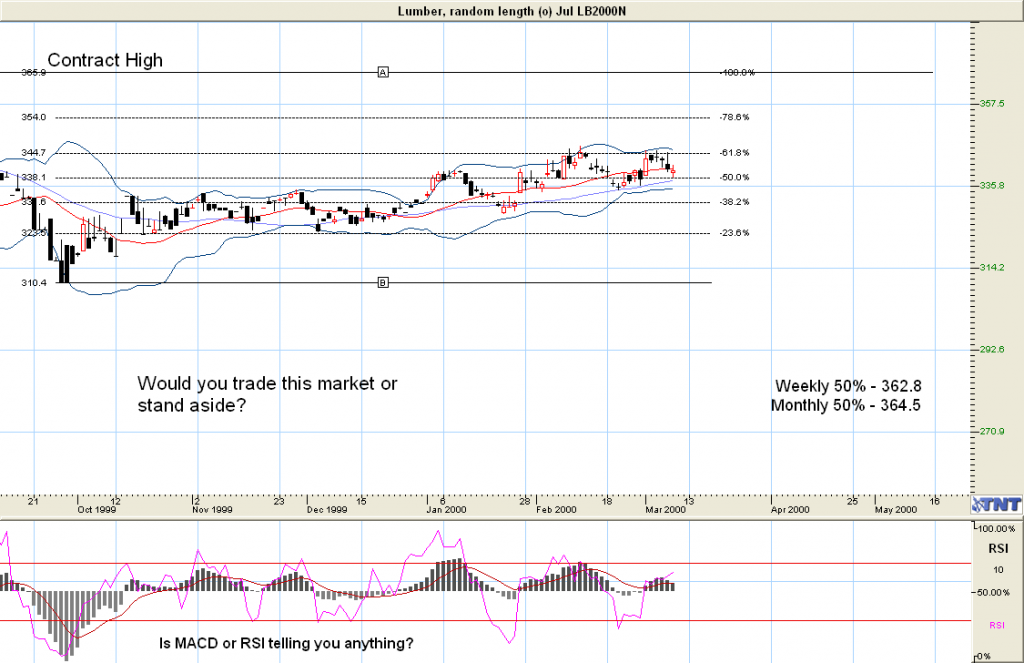
Opportunity 10: Lumber