
Strategy Description
The Crush 1550 Strategy is being traded on the 4-hour (H4) and 1-hour (H1) charts. It focuses on momentum moves in new and existing trends. First, we must identify the market structure as being in a new trend or consolidating an existing one. Once the structure is confirmed, trades can be taken from clearly defined set ups.
What is a trend?
A trend can be defined many ways. A popular way to identify trend is through the swing highs and lows. When a market is making higher highs and higher lows it is an uptrend. When it is making lower highs and lower lows it is considered in a downtrend. The key point is that both must be present to have a trend. Once you have a lower high AND a lower low in an uptrend then the trend is considered over and the market has entered consolidation or an outright reversal of trend. Markets don’t often go from an uptrend to a downtrend directly, but only after a basing period (sideways movement) or some larger timeframe reversal pattern completes.
Another way a trend can be identified is by the moving averages. If the short term average is above the longer term average and they are rising it is considered in an uptrend, and the opposite is true for downtrends. Many traders also look at the 200 period moving average. If it is declining and the price is below it like in the chart below, then the market is in a down trend. You can also see where the market changed directions and began trending up.
Market Structure Example
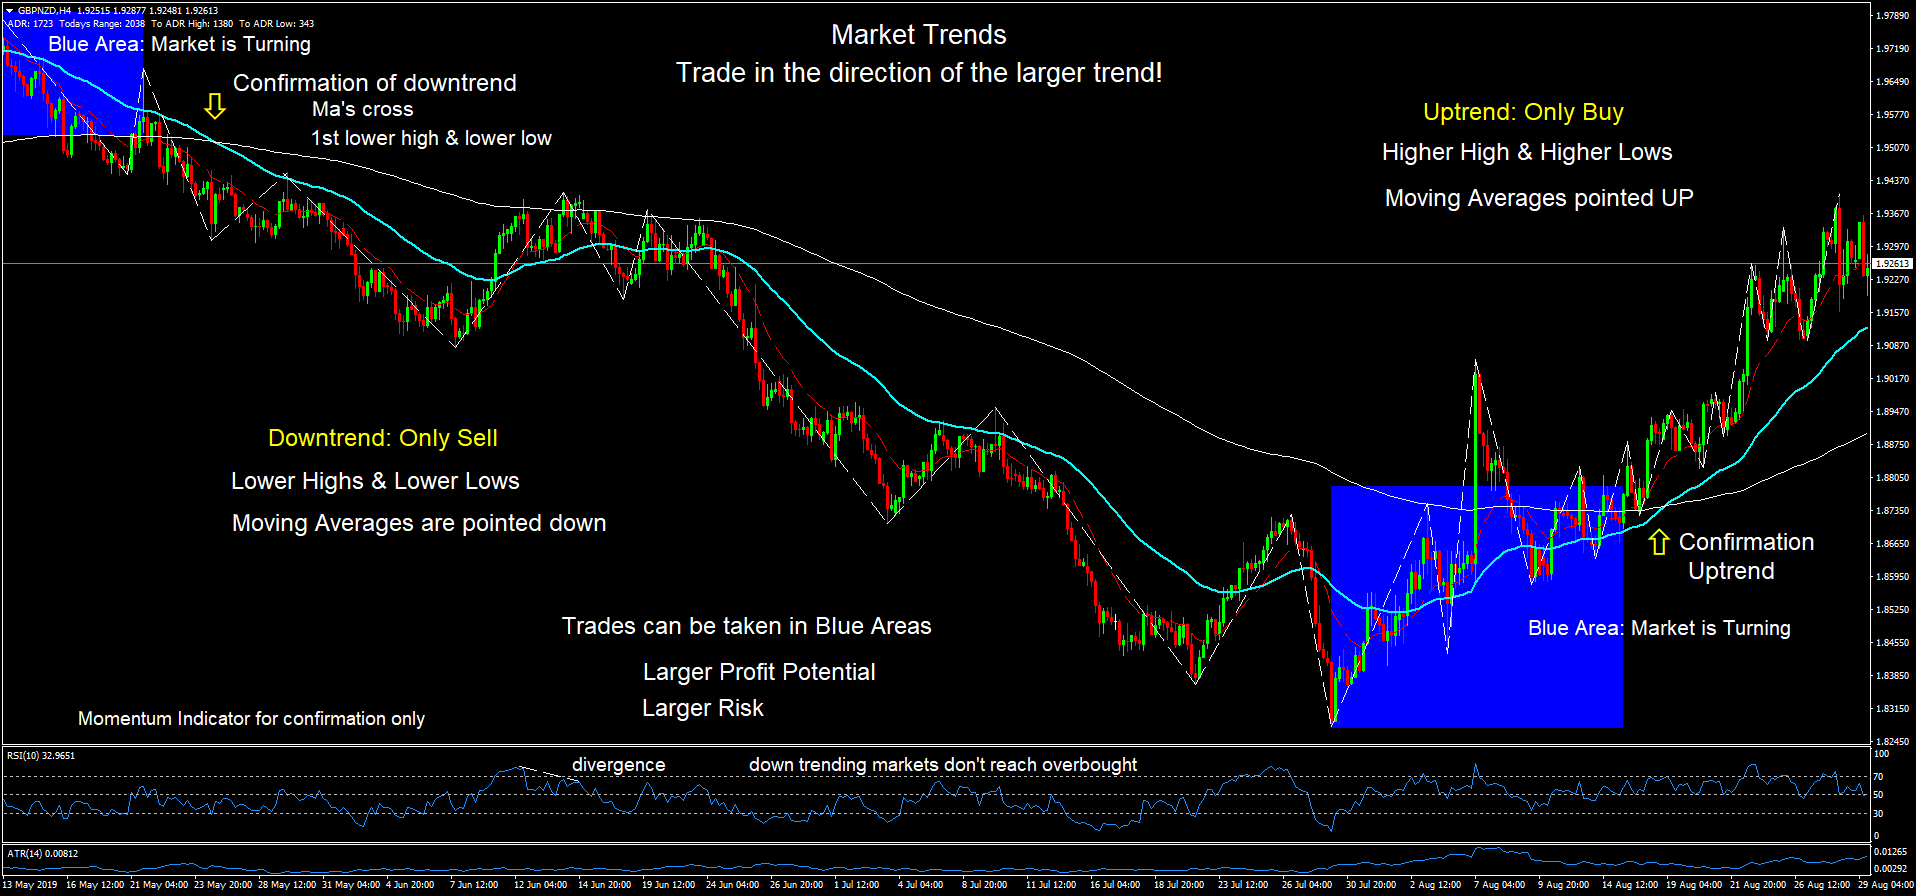
The market structure above is the type of market we want to trade in, trending markets. This can be seen in both the swing highs and lows, and in the direction and alignment of the moving averages.
The blue areas are turning points where the market is not in a clear trend, and therefore trades taken in these areas have a lower probability of success or in other words higher risk trades. However, where there is risk, there is opportunity for the largest gains when catching a trend early. The more experience you gain with the charts will help you to stay on the right side of the market.
Mean Value Analysis:
The mean value is the core part of our strategy, and the mean value zone is displayed as the space between two exponential moving averages. We can see the current market conditions, whether the market is too overextended, flat, trending, at the right price to buy or sell or unstable market conditions.
The mean value is where the market finds balance, or you can think of it as “fair price”. When the price is far away from the mean value it is considered too expensive. When price enters the mean value zone then new orders enter the market and the price reverses, or indecision enters as the flood of orders battle each other.
During trending conditions, the mean will act as dynamic support or resistance because counter trend moves end here as the market finds value again at the mean. The mean value creates spots on the chart where heavy buying or selling enters, especially when there is an established direction. When the price respects the dynamic support or resistance, it is a good sign of a stable trend. If the mean value is not respected, then the market conditions are unstable. We are taking trades when the price does a pull back into the Mean Value Zone.
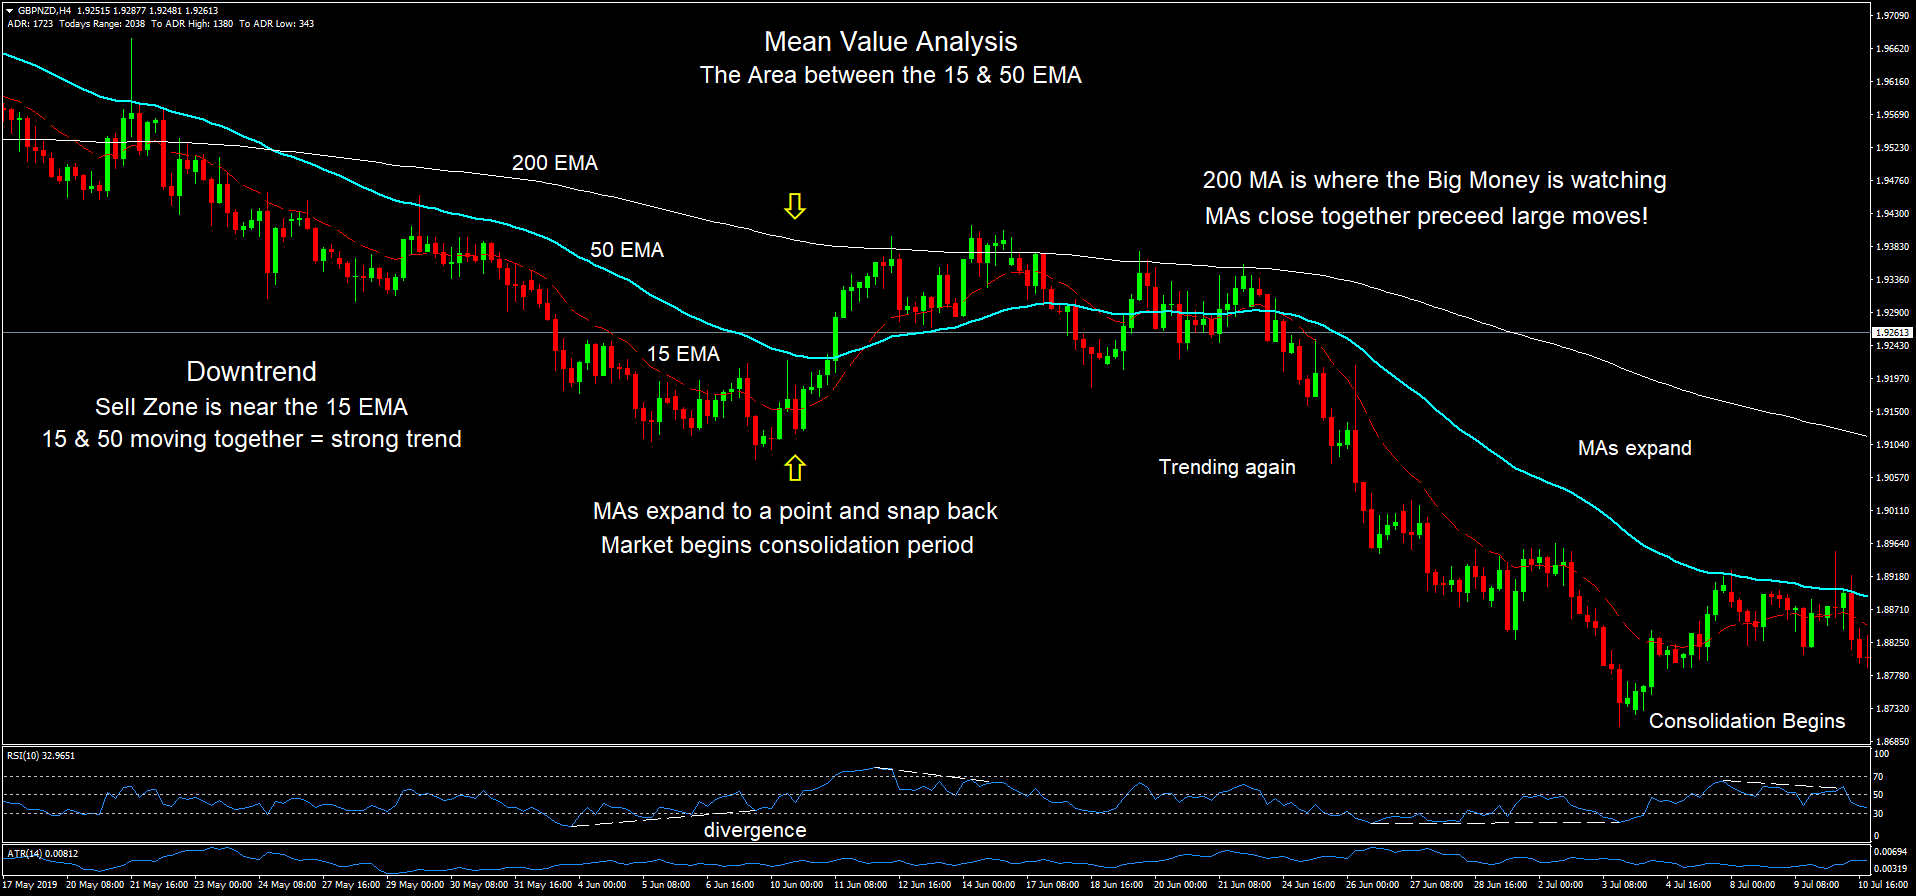
Mean Value Analysis
Moving Averages
50 period EMA (Exponential Moving Average): We are using the 50 period EMA to define the direction of the market whether up or down, and take trades only in the direction of the 50 EMA. When the price is above the 50 EMA and the 50 EMA is above the 200 EMA, we will only take buy trades, and when the price is below the 50 EMA we only enter in sell trades. This is the number 1 rule of this strategy.
15 period EMA: The 15 period EMA acts as a guide for determining trend expansion or contraction and we will use it for some of our entry signals as well. When the 15 EMA and 50 EMA are expanding, meaning the moving averages are moving further apart, the trend is considered to be strengthening. If they are contracting or getting closer together, then the trend is consolidating or weaker.
During the strongest trends the moving averages will move together smoothly.
200 period EMA: This is the long term moving average that the big players are watching. They use this average to determine if markets are longer term bullish or bearish. They often mark the end of a retracement and is a good place to take a trade in the direction of the larger trend. In the example above, we would take a short trade when our entry reason is met.
The chart above shows the mean value zone; the space between the MA’s. See how the moving averages went through expansion and contraction. Signals are generated when the price crosses the 50 EMA or comes back to the 15 or 50 EMA and reverses while the MA’s are expanding.
Also, notice how big moves start when all the moving averages are close together and end when they become far apart. This happens over and over again and makes for the biggest profits.
Trader’s Mindset:
Learn to focus on the information that helps you spot opportunities to make a profit, rather than focusing on the information that reinforces your fears. Being prepared and gaining a thorough understanding through experience will help you to overcome your fears and the problem with the way you think.