
Targets: Targets are profit-taking opportunities. When you make a trade, you must know what your profit target is before you place your order.
If you don’t know what it is, how can you figure your Risk/Reward ratio?
You can figure profit targets for long-term, mid-term, short-term, or even day trades.
The question always remains, when is the right time to take profits? I want to state again that you can’t lose money taking profits. Let’s look at a few methods of setting some profit targets.
We are going to look at the 123 Bottom formation on the following chart to see where to enter the market and where our first profit target would be. This example is going to be for a long-term trade.
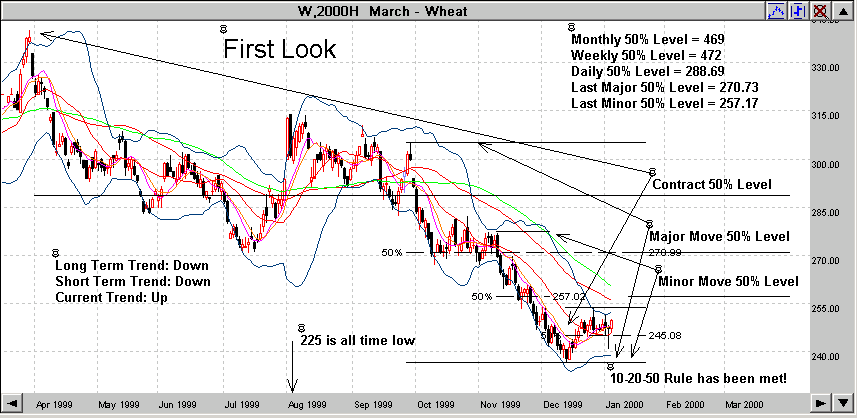
First Look: Let me say, that if you are not doing as much detail on your charts that I do, before placing a trade, you are making a costly mistake. This looks like a good trade so far. As for the 123 Bottom formation, all the 10-20-50 rules have been met. As you can see, the #3 Point went well below the 50% retracement level. (The closer it gets to the #1 point, without exceeding it, the better.)
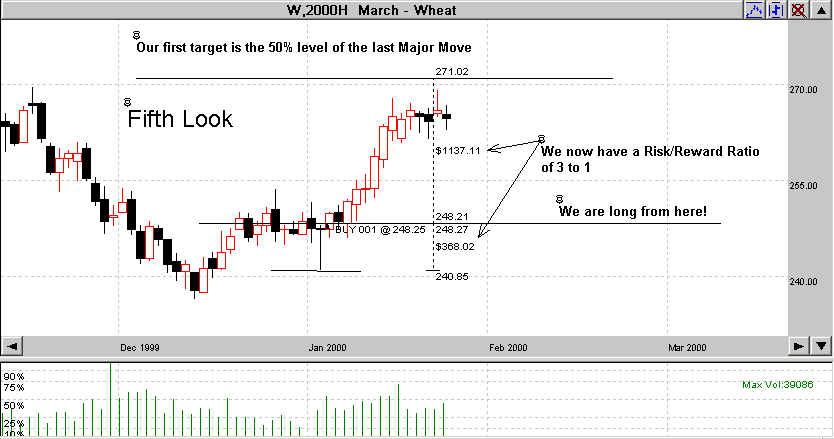
We now have some profit targets. The first one, the 50% Level of the last Minor move is just above the #2 Point so it’s far too close to use it as a potential target. The first target I would use is the 50% level of the last Major move which is 270.73.
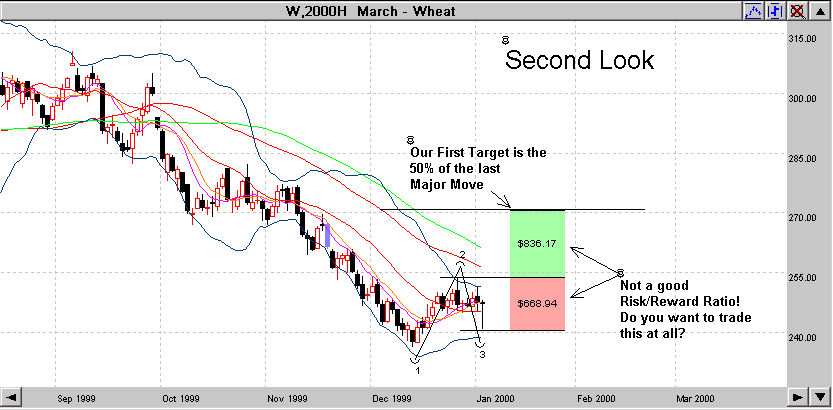
Now, where do we enter the market, and where do we put our Stop Loss order? Let’s look at the next chart and see what might make sense. I’m using several charts here, for sake of clarity. You would normally keep all this on one chart. Gecko Charts are incredible at doing this.
Second Look: As you can see, the Risk/Reward Ratio is not all that great, even if you put your Stop Loss below the #3 Point rather than below the #1 Point. Now what do you do? Do you make the trade or pass on it. Tough question. Here’s something to at least consider; remember we talked earlier about Buying Support and Selling Resistance? Could we use that here? If so how? Are your mental gears turning yet? I hope so. Have you figured it out yet? Lots of things to think about here! Let’s look at the chart again in a larger view and see if we can come up with a better plan.
Third Look: The chart is now taking on a new look and feel. Several things are going on here. The first thing that jumps out at me is the Spike Down Day. It closed in the upper 25% of the daily trading range. Remember we talked about how to trade Spikes in a previous lesson.
If we trade this based on the Spike and it in fact works, it should also form Day3 of the Bottom Blip too. This is getting interesting! Volume, what’s volume doing? It’s up! That’s a good sign too.
If we place this trade, our profit target would be the same but our Reward/Risk ratio is now 3 to 1, not 1 to 1. Are we on to something here? Are we forgetting anything?
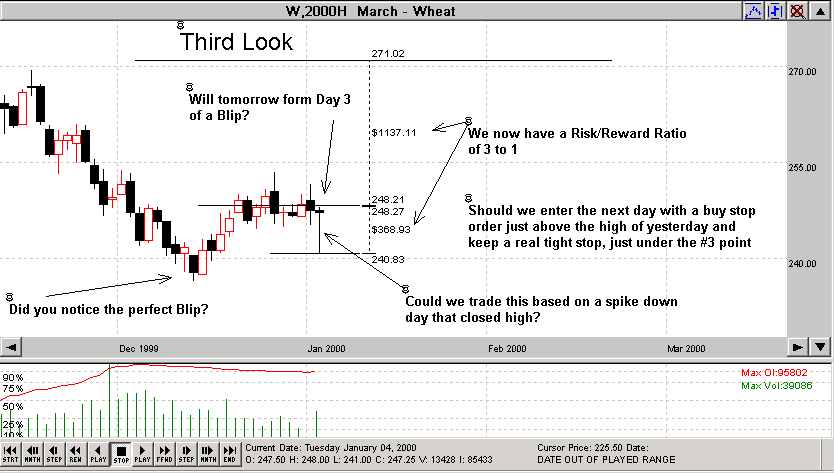
Should we be looking at anything else? (No, you don’t call your broker and ask him what to do. This is your trade, not someone else’s! Heck, let’s go for it. Let’s enter the market tomorrow with a Buy Stop order just above the high of today. Ready!
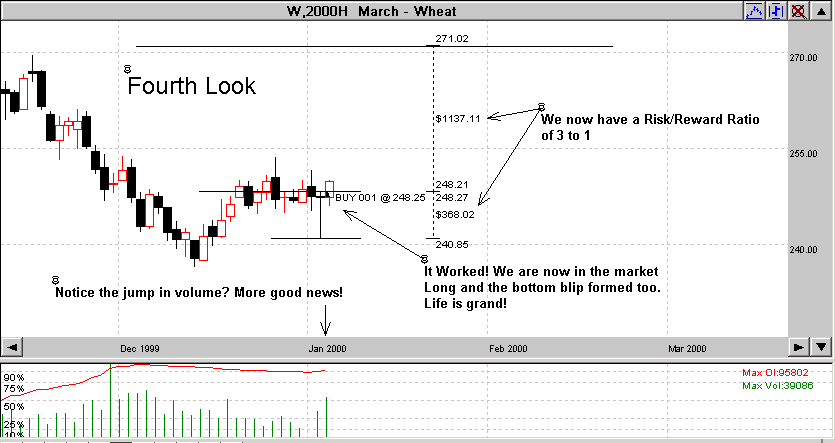
Don’t you love it when a plan comes together! So, we are now long the market. What do we do now. Let’s take a look at the next chart and see what happens and better yet, what to do next.
We have a dilemma! The price is yet to reach our target price, but, a Top Blip formed. This is a great warning sign that the price may drop. Based on our understanding that all market moves make a 50% retracement, should this move be any different?
What if we got out tomorrow? But if we did and the market rallied again, we would still want to be in the trade. Right? There is a solution.
Let’s place a Sell Stop order just below the low of today. This way, if the market rallies, chances are we will still be in the trade, but if the market drops, we want out and also want to lock in some profits. So, if we moved our Stop up to just under the low of the day, that locks in a guaranteed profit, and if the market does rally without breaking the low, we would still be in the trade and not get stopped out. The best of both worlds here.
That’s what we decide to do. Let’s look at the next chart and see what happens.
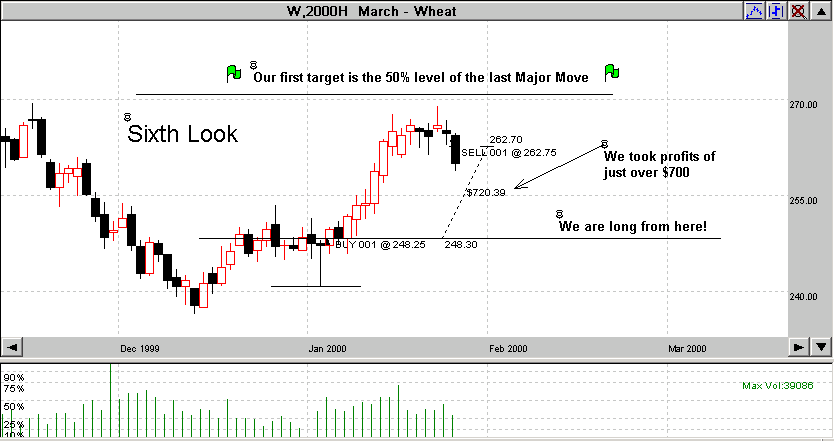
Congratulations! A profitable trade and we made the right decision to get out and take some profits. But, is the trade over yet? Do we want to get back into the market again? If so, where, and how, would we do that? Good question!
There are a couple of things we have learned in the course so far, one of which is that almost all prices will make a 50% Internal Retracement at some time. Will this one? If it does, how do we take advantage of it? What we could do, is wait on a 50% Internal Retracement to take place and then enter the market long again on a bounce off the 50% level if it does in fact make the retracement. We decide to do just that. We call our broker and place an Alert, not an order, to be notified if the price hits the 50% level. Let’s play the chart forward (Love these Gecko Charts) and see if the 50% level gets hit.
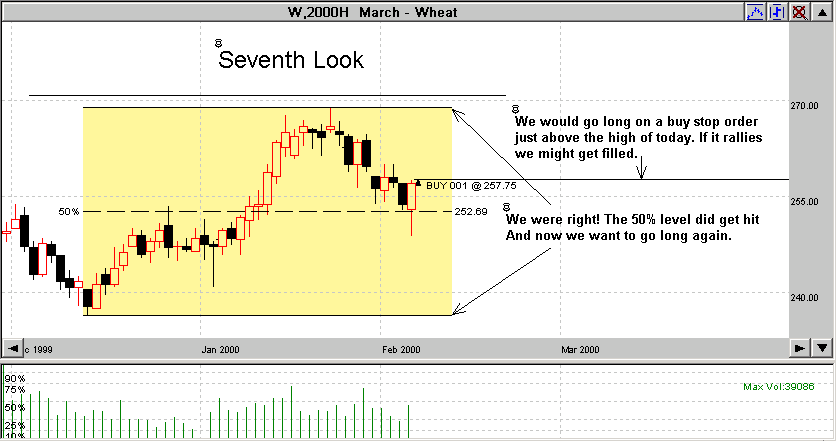
Eighth Look: As you can see, it did get hit. What do we use for a profit target? It’s the same one we’ve been using, the 50% Level of the last Major Move. So, we call our Broker, and place an exit order to take profits at the 50% level if it’s reached. Our stop could be below the low of yesterday. Let’s look and see what happens next.
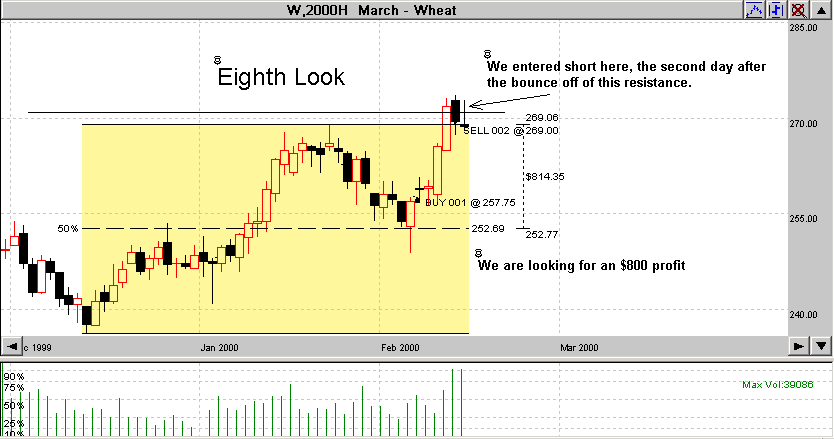
Ninth & Final Look: it hit our profit target and we took profits, but what could we do after that? Good question! What I would do would wait and see if it can penetrate the resistance level. If it does, I might go long, if not I would short the market a day or so later if it did not break the resistance level. If I were short, I would take profits at the 50% Level of the last move it made and place an exit order at the 50% Level or place a tight stop. Let’s look and see what happens.
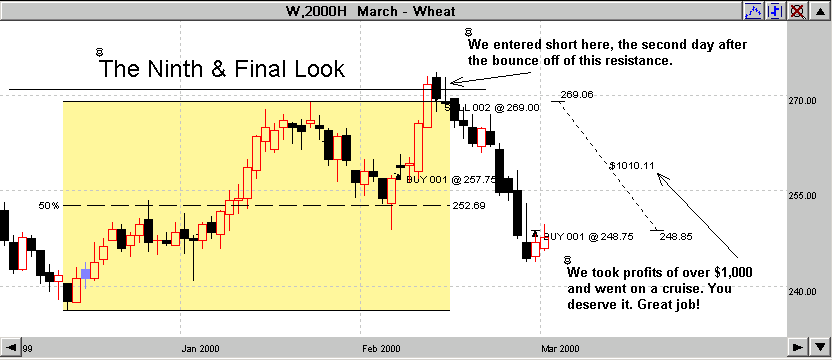
So, now we are short the market and have a profit target, and we’ll follow this one down with stops. What do you think will happen next? I bet you know! Great Job!
Short-Term Profit-Taking
Sometimes I like to take short-term profits too. There is nothing wrong with taking short-term profits. I consider short-term profits to be from 1 or 2 days to a week. Each person has to develop his or her own rules, but this is what I like to use.
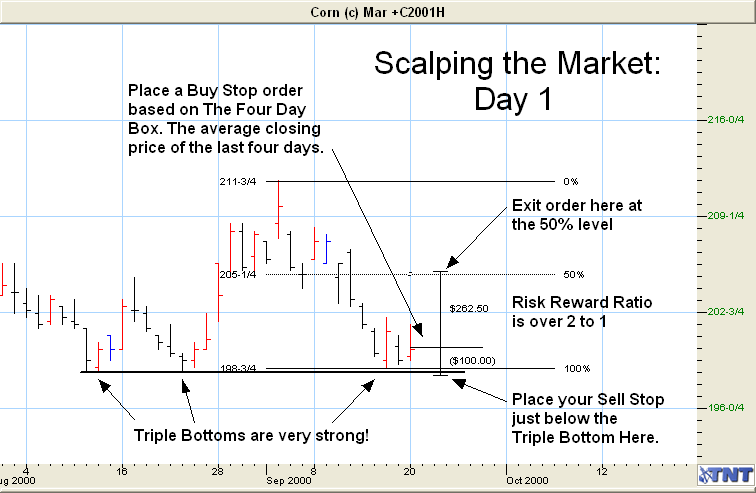
Day One: This little formation is interesting. What do you see? What I see is strong support, a Triple Bottom, that we learned about earlier. This is really strong support! The 50% of the last minor move, as shown on the chart is really close; too close to place an order above the high of the last day as our risk reward ratio would not be very good. I want you to think about this.
How could we enter long?
Here’s how. Remember we talked about entering a trending market in an earlier lesson? Why don’t we do the same thing here. Take the Average Closing Price over the last 4 days and enter the market tomorrow at that price. Just a different situation than what you learned earlier.
For whatever reason, we just want to “Scalp” the market and try and pick up a quick $200 or so, after commissions. Do you see an area that we could use for a target? Right! The 50% level of the last minor move again. I’m so proud of you because I know you knew the answer to that one before I told you!
Let’s play the chart forward and see what happens on the next chart. Now remember if our target is hit, we have an exit order already placed to get out with a profit, so it will happen automatically. Also, we have a very tight stop on this trade and I feel good about it, because the stop is just under the Triple Bottom support area. Let’s Look!
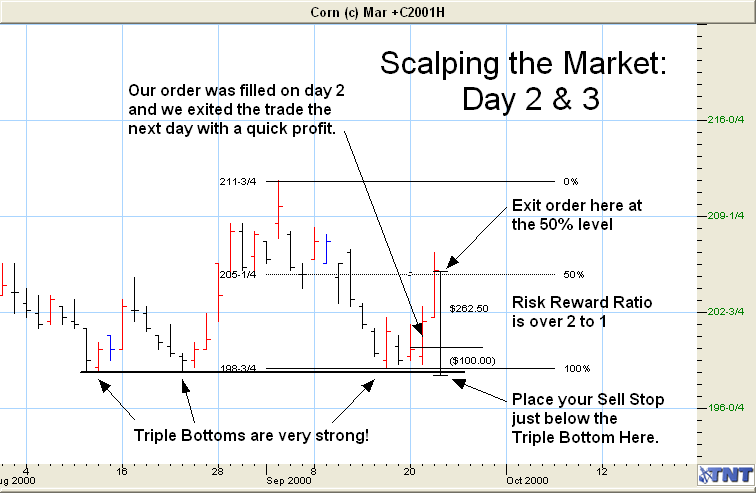
As you can see, our Trading Plan worked out just fine. Also notice how well it worked on getting into the market at a good fill price using our Four Day Average. I used the average of the last 4 days closing price rather than the last 4days lows since it was not a trending market and the bottom was a major support.
This is just another way to use the average price to enter a market. We also had our exit order in place at the same time we entered the market, and exited with our expected profit of just over $200 after commissions. This is a great way to build a small account.
Trailing Stops
This is very important to learn because if you are in a long-term trade, you don’t want to keep your stop at the same place it was when you entered the market.
Let’s say that you are short the U.S. Dollar market and the price keeps going down and everything is just fine. You are happy, you’re making money and all seems well. What happens if the market starts going back up? You start losing money because you are short, right? Well, there is a way to lock in the profits you’ve been making. You do that by moving your stops. This is called trailing your stops. If you don’t learn to do this, you are going to lose a lot of your profits.
The question is, where do you move your stop when you want to lock in your profits? Although there is no correct answer to this question, there are several ways to accomplish it. One is to use a specific dollar amount of say $500 and just keep your stop $500 away from the current day’s closing price. I don’t think this is the best way to do it, but some people like trading this way. Keep in mind that you must call your broker everyday to change your stops. He/she can’t do that for you. Or if you are trading online, change them directly into your system.
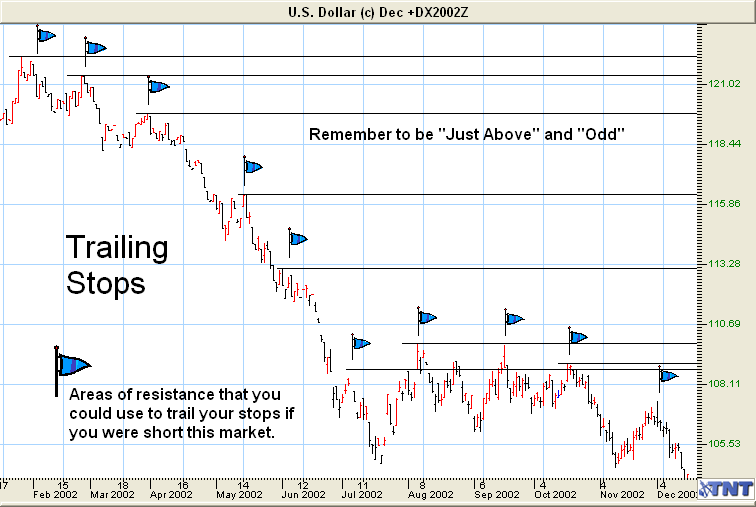
I think there is a better way to place your stops. As you see in the example above, I like to use prior support or resistance levels. These are places the price would have a hard time breaking through. I think they are great places for stops. Remember to place your stops “just outside” and “odd.” Another popular way used by more statistically minded traders is to use multiples of the Average True Range. Basically this is believed to help keep you from being stopped out prematurely, by the daily natural fluctuations in price. (Check the Resource section for more details).
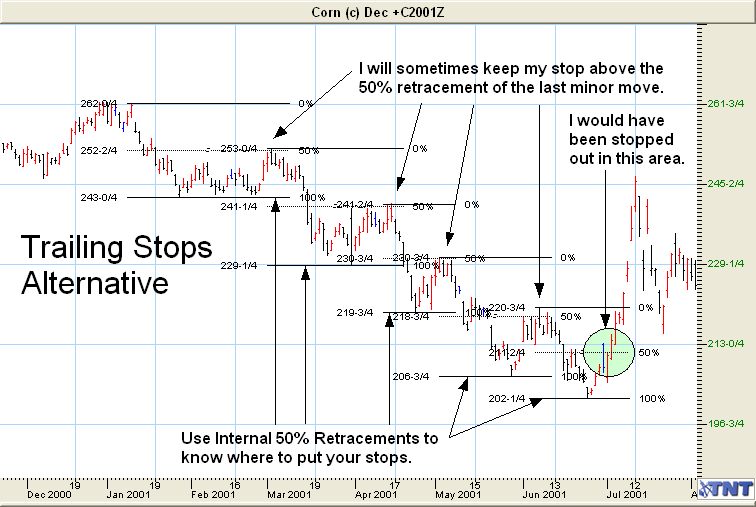
I have drawn a line across most of the resistance points. Why is this important? If you had been shorting the market anytime during this contract, you would have wanted to place your stop just above one of these resistance levels. Which one you use is a little more of a challenge.
You want to place your stop far enough above to keep from getting stopped out early in the daily fluctuations, called “market noise,” but close enough to keep your losses low or to lock in your profits. If you place it too close, you get stopped out and if you place it too far, you take too much risk.
I like to draw resistance lines (support lines should also be drawn when you are long the market) all the way across the chart. You might draw a line across all the resistance levels in one color (say red), and across all the support levels in another color (say green). This way you have a good idea of how far apart they are. If you are short the market, you want to place your stop just above the first one or two resistance lines (below a support line if you are long), depending on how much risk you want to take.
At times, there might be three or more resistance lines above or below where you place your order, depending on the risk you want to take and how far apart they are.
The way I decide where I want to place my stop is to look at how much risk there is at that particular price point. I then look at how much the market is moving up and down each day (market noise). I don’t want to be within the average day’s Trading Range and I don’t want to be so far out that I can’t control my risk. I then try to find a happy medium and that’s where I put my initial, or trailing, stop.
Another great way to place stops is based on the Internal 50% Retracements. Remember them? Let’s take a look at another example, and look at it in a little different way.
I bet you have already started to figure this out on your own. But I thought I would mention it to you anyway.
Since you know that Internal 50% Retracements happen over and over again, why not use them as a place to put your stops? Just think about it for a moment. At each “move” that you see above this chart, I have drawn out the 50% retracement area. Actually, the software did it for me, isn’t technology great!
Since you know that each move, minor or major will make a 50% internal retracement, you can use this knowledge to your advantage. You can keep your stops “just above” this 50% level and at an odd price. This way, you lock in some profits and hopefully don’t keep getting stopped out all the time. Later in the course, I will show you how to be even more accurate than this on proper placement of stops.
You will also want to keep moving your stops down (up when you are long) to lock in your profits. Again, make sure that your stop orders are GTC orders, not day orders. If you are currently trading, or have traded in the past, go back and look at the trades you got stopped out of. How many of them would you have stayed in and made a profit, if you had just kept your stop above or below the 50% internal retracement area?
50% Levels As Targets
Keep in mind that when you are looking for where a price may eventually go, the 50% level is a good target.
You can use several different 50% levels. I’ll list some of them below.
- 50% level of the Monthly chart
- 50% level of the Weekly chart.
- 50% level of the Daily chart.
- 50% level of the last major price move.
- 50% level of the last minor price move.
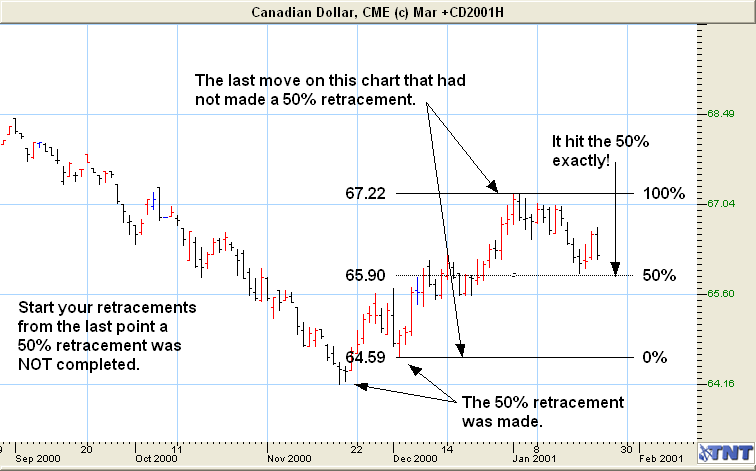
You can see on the following chart, the last move that had not yet made a 50% retracement was between the last week of February and the middle of March. The price should retrace 50% of this move to 69.95. As you can see it did just that.
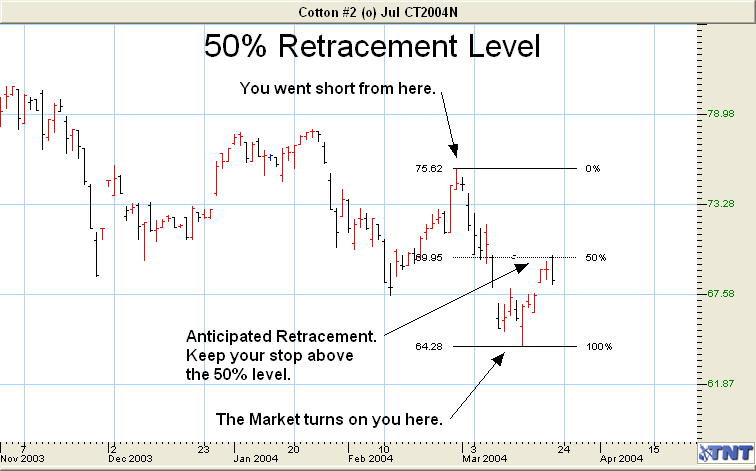
You can see on the above chart, that you are short the market. About 2 1/2 weeks into the trade, the market turns against you. Another trading dilemma! Do you get out or stay in? Just looking at this chart, I would stay in the market, anticipating a 50% Internal Retracement from the last minor move. I would make sure that my stop was “just above” the 50% level here and just above any other resistance level that might be at or about the same price.
If the price goes past the 50% level, then I would be stopped out with a small profit. If the price hits it, which it did, and then drops again, I’m still in the trade. As you can see this strategy worked this time and we stayed in the trade for a nice profit. Now let’s look at the chart again.
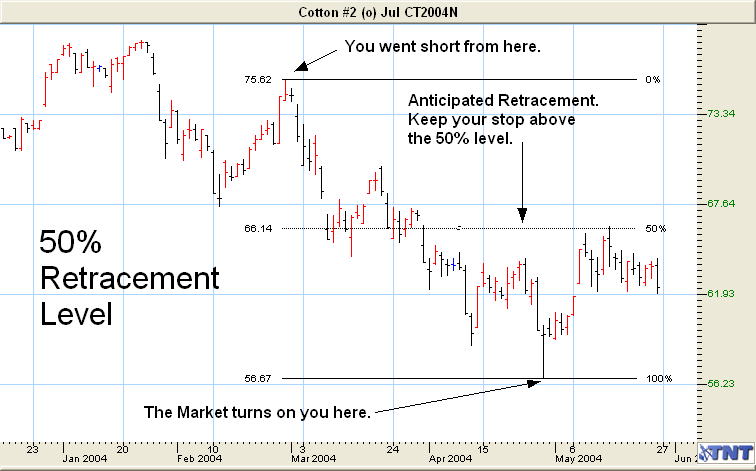
This has been a good trade so far. The market turned on us and gapped up as you can see. I probably would have gotten out of the trade that day as I would have been trailing my stops. However, if I wanted to stay in the trade, I would have drawn out the 50% level of the last major move, as I have done on this chart.
It’s also interesting to note that the 50% level on this chart also became a Common Number that you learned about earlier. You should have been aware that when you drew the 50% level, that it hit, it could become a Common Number, which is a strong resistance level itself.
You could do a couple of things here. One of course is to stay in the trade. Another is to get out of the trade, wait on the anticipated 50% Internal Retracement to take place, and once it did, enter the market short again, with your stop directly above the 50% level or Common Number.
Be aware of where the 50% levels are when the price gets close to them. Watch closely for a price reversal and keep your stops tighter than normal to lock in your profits.
More 50% Retracements
I’m going to show you a series of charts with the 50% levels drawn in. Some will be Contract 50’s, Monthly 50’s, Weekly 50’s, Daily 50’s, Major and Minor 50’s. Some will contain more as most charts do.
Study them carefully and then practice drawing them out on your own charts. Only then, can you become a firm believer in this.
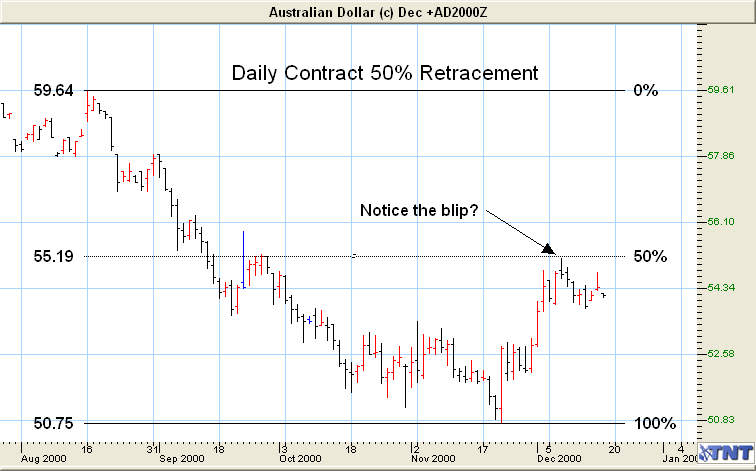
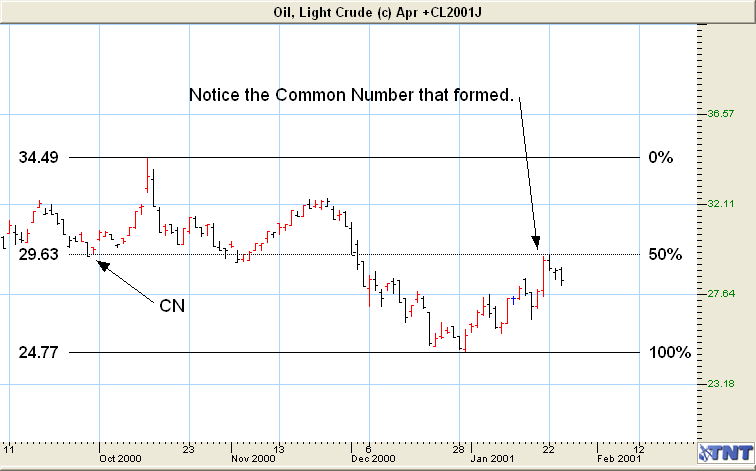
Notice that in the above chart, the 50% level of the contract also became a Common Number. If you had gone long when the price reversed at the end of November, you should have had an exit target to take profits at the 50% level. When the Top Blip formed at the 50% level, you could have gone short this market. Your initial profit target at that point could have been a 50% retracement of this last minor move down to about 53.00.
On the following chart, you can see that the last major move had yet to make its 50% retracement. However, when it did, it hit it perfectly. It also formed a bottom blip at the same time.
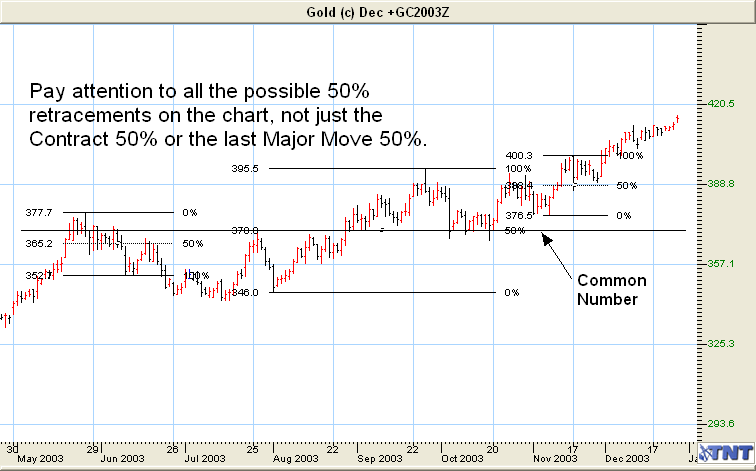
In the chart above, notice a Common Number formed here too. This happens over and over again. Be aware of them and learn to anticipate where they might take place. Use them for entry or exit targets.
Support & Resistance Targets
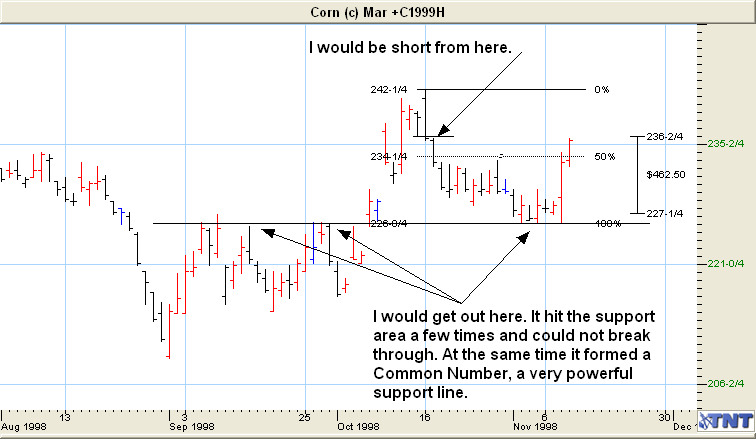
Often the price will hit either a support or resistance level and then reverse. And when it forms a Common Number, this can be a great target whether you are long or short. Let’s look at the following chart where this has happened several times.
There are six key factors in looking at support and resistance levels.
- Time
- Volume
- Date
- Hits
- Highs/Lows
- Levels & CN’s
Let’s look at them one at a time to get a better idea of how we could use them.
Time: All prices trade in a time range of a couple of days, a couple of weeks, a couple of months, couple of years, etc. If prices tend to trade in certain time ranges for an extended period, this becomes a stronger support or resistance area than if it only traded there for a day or two. A small Trading Range or Narrow Sideways Channel fits the picture well.
Volume: Heavy volume means that a lot of contracts were traded in that price range. Of course when 5,000 contracts were traded and the price remained in the same support or resistance area, then that area is more important than if just 1,000 contracts were traded in the same period of time.
Date: Just how long ago was the support or resistance area formed? For example, last week is much more important than last month, and last month is more important than last year.
Also keep in mind the importance of Round Numbers that we talked about earlier. Support & Resistance Levels tend to “stick” to round numbers.
As we talked about earlier, Support & Resistance points are the ideal place to either, enter the markets on a break past them, exit the markets at the bounce off of them, or a perfect place to put your stops.
Just remember not to put your stops exactly at the support or resistance area. Rather, place them just above or just below them. Also, never place your stops at an even number, especially if it’s a multiple of ten, like 10, 20, 50, 80, etc.
Hits: Hits, as in the number of times the Support or Resistance area is tested (gets hit). Remember discussing Double and Triple Tops & Bottoms? I think this is one of the most important factors. It doesn’t take a rocket scientist to figure out that if the price has hit a support or resistance five times, then that area is more valid than if the price only hit it once.
Highs/Lows: A contract high or low carries more weight than any other Support or Resistance area. It take a lot more energy to take out a contract high or contract low. That’s why Double and Triple Tops and Bottoms are so hard to break through.
Let’s look at some more charts and see how we could apply some of this information you just learned.
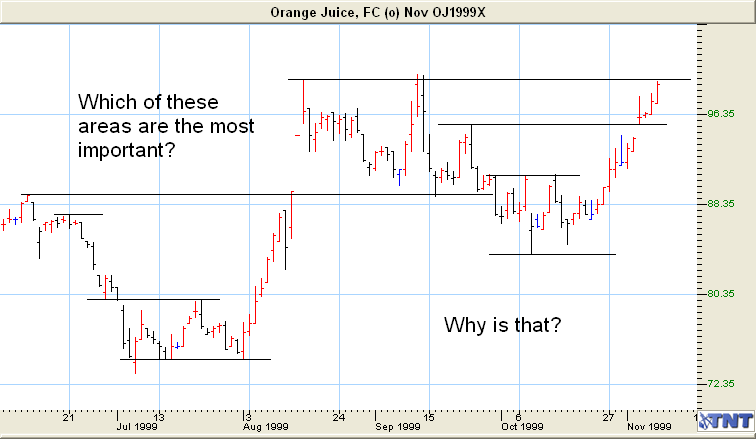
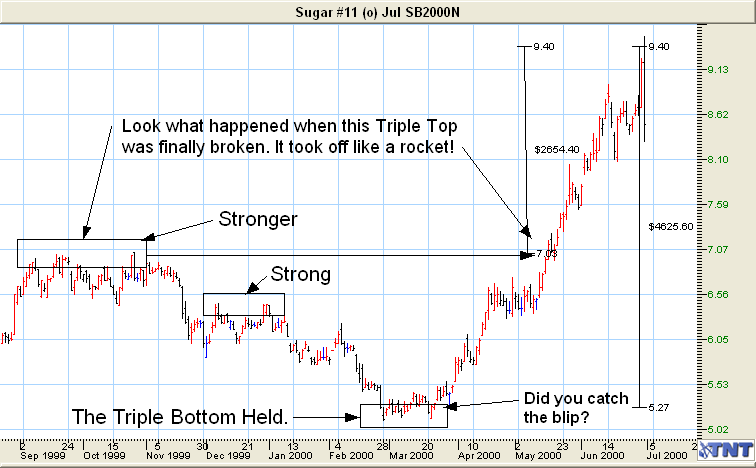
As you can see in the above chart, we have both Triple Tops and Triple Bottoms. Let’s look at the Triple Bottom here. When the price hit the bottom support for the third time, notice it “took off” and rallied. I will always trade a Triple Top or Bottom. Yes, I said always!
Look at the following chart. Why is the resistance area in the top box stronger than the support area in the bottom box? I bet you know! By now, you should be looking at charts a little bit differently than you have in the past. At least I hope so anyway.
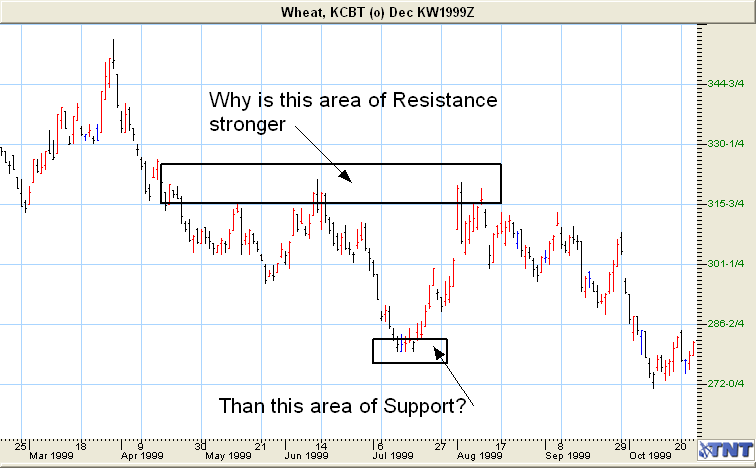
Minor areas of Support and Resistance cause a pause in the price and major areas cause the price to reverse.
Fear & Greed
Fear and greed are a traders two worst enemies. If you don’t learn to control them, they will control you. If they control you, you’ll lose! If you learn to control them, (along with good trading skills) you can win in this game called trading.
If you learn nothing else from this course, learn this: More money has been lost through the fear of loss than through the desire for gain. Although this might be a natural instinct, it must be overcome. You must learn to take your losses or you will not be entitled to your gains.
Many traders will place stops that were carefully planned and then just before the price hit their stop they bailed out for a loss, only to see the market turn around and head back in the direction of their trade. If they had stayed in the trade, they would have made money, but the fear factor took over and they turned a winning trade into a losing trade.
It’s important to trust your stops. If you placed them properly, you must stick with them. I can’t tell you how many times the market came within one or two ticks of my stop and then turned back around and became a profitable trade.
If you place a stop, stay with it, or don’t make the trade to begin with.
Greed, nasty old greed, has cost more traders money than I care to imagine. This is how it works: you get into a winning trade and have good profits but refuse to get out. The price hit your profit target(s), and you think you can squeeze an extra penny or two out of the trade. You had your exit stops in place but cancelled them. You made a good trade, but you just stayed too long, you rode it out thinking that the market would turn around. It didn’t and you took a big loss. How crazy!
You must keep trading in perspective. You must learn to control both fear and greed, or they will wipe out your accounts. If you are going to win in the commodities “game,” then you must learn to limit your losses and add to your winners. If you can do these two things, then you have a good chance at making a comfortable living trading.
Over-Trading
One of the worst things that you can do as a new trader is to over-trade; to have more of your account at risk than you should. Even the best traders can lose seven, eight, nine, or more trades in a row before going back to a series of winners. Think about this; how much of your trading account should you risk on a trade if a good trader could lose seven or eight in a row?
If you are careful with your account, it can give you rewards beyond your dreams. Treat it with disrespect and it will surely treat you in the same manner.
Learning To Paper-trade: As we discussed earlier, Papertrading is simply practicing on paper before you trade with real money. It’s the most important thing that you will ever learn to do. Even experienced traders continue to Papertrade.
The first thing that you need to do is to start keeping a trading journal. I don’t know of any successful trader who does not keep an up-to-date journal of all the trades they have done. In your journal, you enter all of your trades. In Lesson Ten, you will find a complete list of what I look at before I make a trade.
I can’t tell you how important it is for you to keep a journal and it doesn’t matter if you are Papertrading or trading full time for a living.
How To Use Options as Protection
When I say “using Options as protection” I am basically talking about using an option in place of a stop loss. Now, you may be thinking, hang on, you say, “you should never trade without a stop loss!” and that’s just us trying to get across one simple message:
YOU MUST PROTECT YOUR CAPITAL!
Let’s use a 123 formation as an example of how to do this. (Now this is where I must stress that while options are great tools for profit, please take the time to understand the – underlying instrument – Futures Contracts because you will rely on the formations, retracements, and a myriad of other things on the chart to formulate your options strategy).
Now, let’s assume that you’ve been watching the price of corn go down and down and finally make a new one year low. (This would be a #1 point) Let’s further assume that over the next couple of weeks the formation is completed by the #2 and #3 points and that you are now long one contract because prices broke to the upside past the #2.
Usually we would place our stop-loss at/just below the #1 point because the rules of technical analysis would tell us that if price broke below the #1 point (support) that prices would most likely continue to go lower.
Now some of you may be asking; Why would I want to purchase an option instead of using a stop loss? I want the stop loss to limit my loss if the market goes against me! Well, THAT would be a good point. My answer would be this: Options give you “staying power” in volatile markets. The opening range of some markets can be wild and have a nasty little way of stopping you out of the market only to turn around without you on board. Options can also protect you purchase a put option (if you don’t know what this is, please check out the website and the reference section on Options) instead of putting in a stop loss order (for long positions).
Let’s assume that prices suddenly broke to the downside and went below the #1 point. Normally this would take us out of the market (because our stop was hit) but since we are using an option because we have decided that it would be a better tool given the market condition, we remain long one contract. Yes, at this point we are losing money with the futures contract, but we have the option working for us now!
Here’s how: Because prices are moving down, the value of our put option is going up. The intrinsic value is now increasing.
(For those of you who may have forgotten, intrinsic value is one of the components of an option’s value. Intrinsic value is the profit you would realize if you were to exercise the option. The further “in the money” it is, the higher the intrinsic value. For the sake of doing the math let’s use these figures:
Say you hold a put option with a strike price of 200
The market is currently at 195
200 – 195 = 5 (so 5 is the intrinsic value)
So now you can see how the value moves up or down depending on the underlying futures contract price movement. This does not even take into account volatility the real power of options.)
If we choose to, we could very easily exercise our put option and be short a contract from our strike price. This would offset the one corn contract that we have bought, because we have sold one corn contract via exercising the option. Offsetting is an important principle of trading because by offsetting a futures contract, we are able to cancel any obligation to make or take delivery of the commodity. Did I lose anybody there? Let me explain it this way: the long futures position in corn that we had “offset” by the short futures position we entered by exercising the put option we held.
The benefit of doing all this is two-fold. First, we gave ourselves some “breathing room” from being stopped out of a volatile market that we were attempting to profit from. (Hey! If the prices never broke down and instead kept climbing, we would have held the futures contract and been making a profit. At some point we could liquidate the option for whatever value it still had or just let it expire worthless.)
The second benefit being that we limited our loss (if the market had gone against us) to the difference between the price we went long (#2 point of our 123 formation) and the strike price of the option we bought.
Some traders feel that buying an option for protection is a better way to protect capital. Personally, there are few things that are worse than watching prices hit the #1 point (which we know as a support level or resistance level depending on the formation) knocking us out of the trade and then turning back around and making profits without us!
Now you have an option
I know what used to keep me up at night as a “newbie” trader…that my overnight trades would open limit against me! Well, in over six years it has never happened. Yet for those nervous times I wanted to trade futures contracts (instead of options) but I was nervous about the potential volatility I would occasionally use an option instead of a stop loss. It works great and really isn’t all that difficult to do.
Let’s use the 123 formation as an example (the steps will work the same for pretty much any formation).
The basic idea behind a futures position being “protected” by an option is this:
Say you are long one futures contract of March 00 Corn. Instead of placing your order for a stop loss, you place an order for purchasing a March 00 Corn PUT Option. (Why a PUT? Because if the market goes down, your futures contract will be protected by the PUT increasing in value.) There’s no worry about your stop being passed by in a volatile move and you now have a certain amount of “staying power”.
If you were short a futures contract, you would then have a CALL Option to protect your position.
OK, now let’s move on…I’ll post the “lessons” in small steps.
OK, we’re back to the 123 formation. It’s a 123 Bottom (If you like we can refer to the chart here)
So, we have an idea of what we’d like to trade, where the retracement is, and what our risk is. Now we place an open order to go long on a break above the #2 point.
Here’s the difference between using a stop-loss order and purchasing an option:
When I am using a stop, I place the entry order to go long and my stop-loss at the same time. BUT when I want to use an option INSTEAD I do not purchase the option at the same time as I place my entry order!
Number one, I don’t want to own the option until my order is filled. Number two; we are bargain hunters…we shop for the best possible deal for what we need.
OK, on to the next step.
So why are we waiting to purchase the option? Well, the best way to explain that would be to FIRST understand the way an option’s value works (this would be your cue to read About Options Part 1 if you haven’t already).
Let’s go back to our 123 Bottom example. Because we are anticipating prices moving upward (remember the 123 is a reversal pattern) we are long (we bought) a futures contract. So to protect ourselves if prices head South we want an option that will INCREASE in value if prices move lower.
Enter the PUT Option.
If prices head lower then the PUT Option increases in value.(You know that NOW right?) If prices head upward then the PUT Option DECREASES in value…hmmmm. Are we getting the picture? Here it is then:
Because the anticipated breakout is upward and once our entry order is filled prices are (assumed) to be heading higher, ALL OF A SUDDEN THAT PUT OPTION WE WANT TO BUY (FOR PROTECTION) IS NOW LESS EXPENSIVE. Intrinsically, the Option is mow cheaper.
BOOM! This is when we will move forward with our PLAN: Once our futures contract order is filled.
OK…let’s move onward!
The strike that you choose to protect yourself must be at a place that you can absorb the potential loss. OK, let’s discuss what this means?
It’s vital that your risk be defined beforehand (as part of your PLAN) BY YOU! If you can’t afford to purchase the Option that you need to sufficiently protect yourself then (quite possibly) the risk to reward ratio is not right for your trading account.
Okay, you also need to figure WHAT STRIKE PRICE you want to purchase. The #1 point is a place to start. But the closer you can afford to be to your actual entry price, the more protected you will be.
And of course once you see you have made some decent profit (what’s “decent” is up to you, your plan, and your profit target) you can liquidate (notice I did not say “sell”) the option and get back some of your initial costs and begin trailing a stop.
Whatever you do, make sure that you calculate what risk you have between your entry and the Option strike price. KNOW what that amount is, it is vital we know our risk AHEAD of time because that will determine if we can afford to put on this trade in the first place! (The Risk is the difference between your futures contract entry price and your option’s strike price)
OK, now let’s discuss a few things to remember when putting on a trade like this.
Here are the things to keep in mind:
First, realize that even though this Option is “protecting” your futures position, the profits are not realized until you liquidate that Option. There still can be margin calls on your futures contract.
Another thing to be aware of is that the exchange could allow you to trade with reduced margins because of your options.
What you now can do is this: when you decide to enter a market and have decided your risk, you can then purchase an option instead of using a stop-loss. Always be totally certain of what your risk will be.
You now know that if prices move against your futures position and your Option Strike is hit, your Option will then begin to offer you an intrinsic value to offset the losses of your futures contract.