
Continuation patterns are usually some form of a continuing sideways pattern that represents a pause in trend. These are usually a short-term formation compared to the longer-term formations in Lesson Four.
Triangles
Remember that we talked about a trend taking three “hits” before it can be called a trend? Well, a triangle is generally known to take six “hits” before you can call it a triangle. Many chartists feel that a triangle will have only six “hits”, three hitting the top and three hitting the bottom. This has to do with the Elliott Wave Theory. There are many good books about this theory on the market. I might suggest that you buy one after you finish this course.
It takes a little getting used to before you can easily spot them. Sometimes they will represent a top or bottom formation. They can be an ascending triangle, where the price is going up, or a descending triangle, where the price is going down or a symmetrical triangle where the price is narrowing or expanding in a sideways direction.
We talked a little about volume in the previous lessons and the rules still hold true for Triangles. Heavy volume must take place on a breakout to the top of a Triangle. An increase in volume on a breakout to the bottom is not required, at least for the first few days. As a matter of fact, if you see heavy volume on a breakout to the downside, it’s often a signal of a false breakout so I usually won’t trade it until the breakout confirms, which might take several days. The risk is just not worth it.
In Lesson Three we talked about how far the prices should move out of a channel and we can also measure how far prices should move out of a triangle once it’s penetrated.
The way that I measure them is to take the widest point of the Triangle and measure it in points. When the breakout occurs, the price should continue for at least the same number of points.
Let’s take a look at the following diagram to see how to measure this.
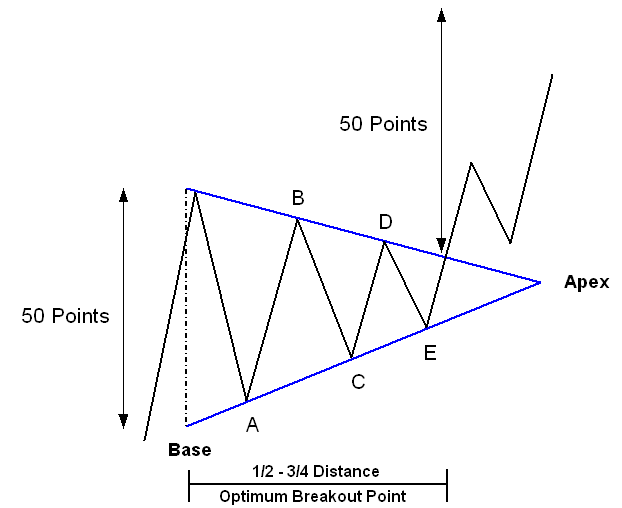
As you can see, the height of the Triangle here is 50 points at its widest point, so when the price does breakout, it should continue at least the same distance. You can use this rule to calculate your profit target when figuring out your Risk/Reward Ratios that we will talk about later in the course. Be aware that the minimum move the market needs to make after the breakout is the high or low of the widest part of the triangle.
Also, after the pattern has developed, watch where the breakout occurs. The biggest moves tend to come from breakouts that happen 1/2 to 3/4 the distance from the base of the Triangle to the Apex (See diagram above). Think of a triangle as a spring being wound. At some point the pressure builds up to the point where the spring pops! If the price continues to the Apex, chances are it will be a failed pattern, and a Channel or Trading Range will emerge.
After the breakout, the price will often “Test” the Triangle with a pull back towards the Apex. This doesn’t always happen, and you run the risk of missing the trade. If this happens, you should not “chase” the market and look for the next opportunity to enter.
After the breakout, the price will often “Test” the Triangle with a pull back towards the Apex. This doesn’t always happen, and you run the risk of missing the trade. If this happens, you should not “chase” the market and look for the next opportunity to enter.
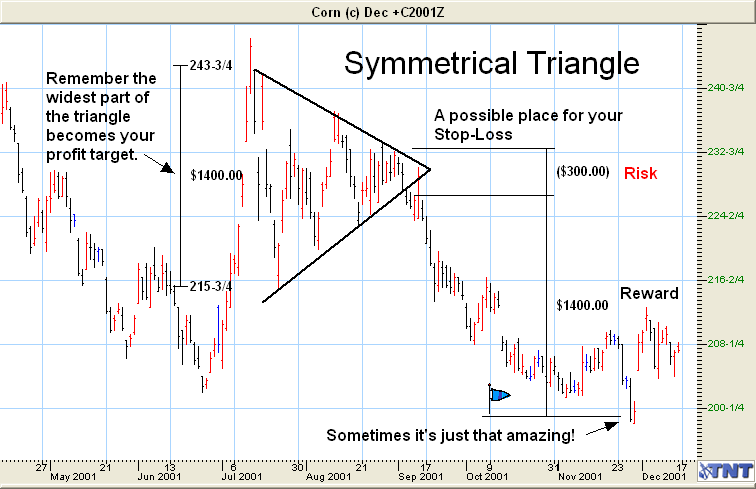
In the example below Corn entered a Symmetrical Triangle in June 2001 and the breakout came in the beginning of September. Notice how the price jumped back up towards the apex? Had you moved your stop-loss too quickly you might have gotten stopped out of this trade.
In the example below Corn entered a Symmetrical Triangle in June 2001 and the breakout came in the beginning of September. Notice how the price jumped back up towards the apex? Had you moved your stop-loss too quickly you might have gotten stopped out of this trade.
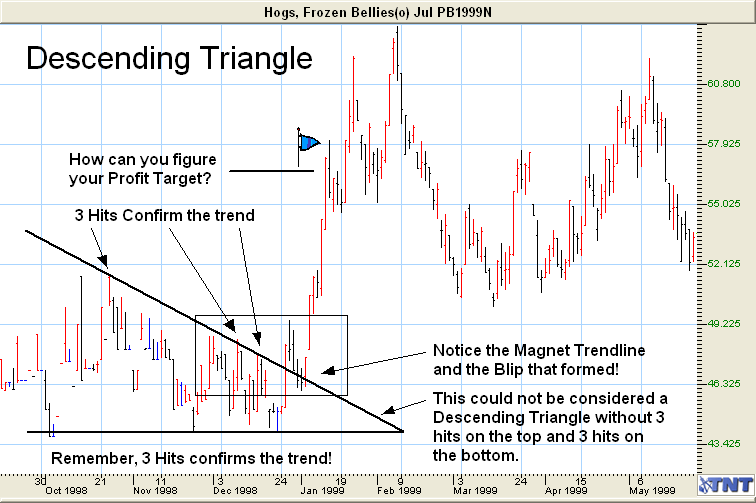
A descending triangle is a descending trend line with strong support at its base. Just the opposite holds true for an ascending triangle where the price is heading up and there is strong resistance at the top.
On the following chart there is a descending triangle. It has major support across the bottom at about 44.00. The trend line is obviously down but broke out at the end of December. You would, of course, have wanted to go long as soon as it broke out.
If you are one for the conservative side, wait until the closing price has been above the trendline for two consecutive days. Place you order to go long above the second day’s high. Remember in Lesson Two we talked about how the closing price should be above the Trendline for two days to consider the trend to be broken. You will be giving up some profits to make sure the breakout isn’t a false breakout.
You can see major support at the bottom of this triangle, so it’s a good place to put your initial stop; maybe 43.39 or so, just below the support line.
An ascending triangle is an ascending trendline with strong resistance at the top. This particular Triangle produced a profit, as the price traveled an equal distance out of the breakout compared to the widest part of the triangle.
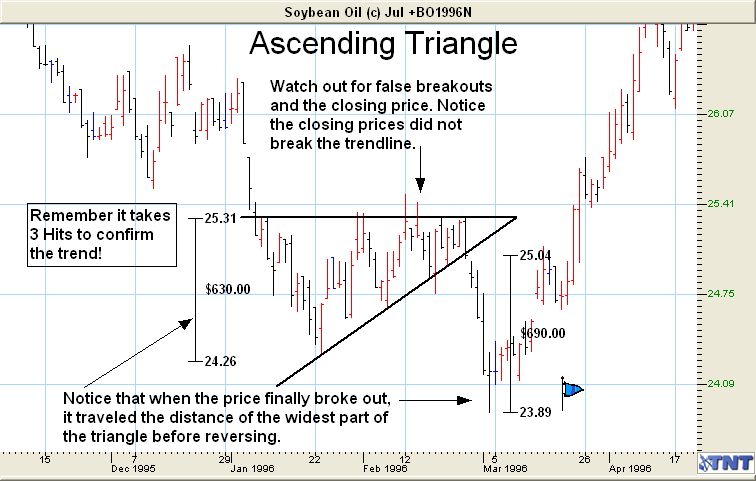
Also notice on this Triangle that the price kept bouncing back up and down and hitting the top of the Triangle several times. This would have been a clue that it was not going to hold. Do you see the Common Number that formed? Look again. See the lowest price inside the triangle? Now, look to the right of it, just before it gapped up. Draw a line across these two points. It’s a CN, and see how the price gapped up when it was broken? Are you starting to understand the importance of tying everything together? I hope so!
Wedges
Wedges are a common formation as well. They look similar to a Trading Range that is narrowing or widening, depending on how it forms. You can trade on either side of the wedge if a breakout occurs.
Place your order just below the wedge for a short breakout or just above it for a long breakout and use a day order only. That way, if it doesn’t get filled that day, you don’t have an open order that might get filled weeks later when you don’t want it to.
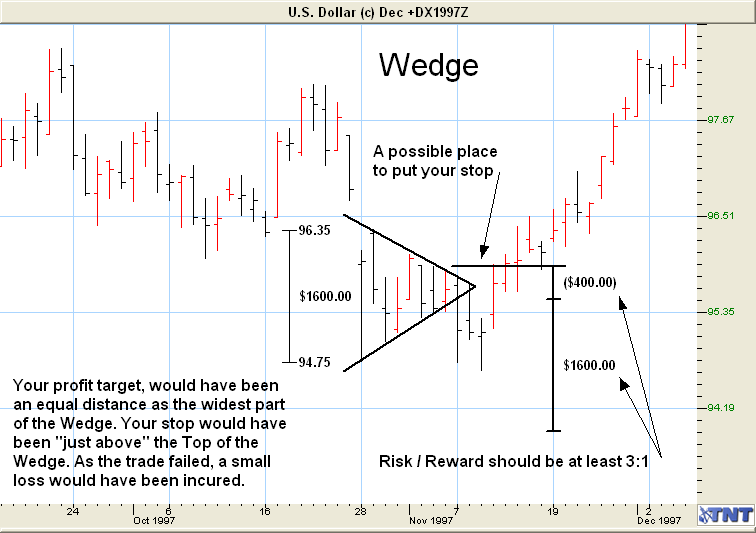
When looking for a good place to put your stop, you could put it on the opposite side of the wedge from your entry position, or look for a strong support or resistance point that meets your risk/reward ratio.
Also keep in mind that your profit target should be the same distance from the breakout as the widest part of the wedge. Let’s now look at the following chart to see one that did work.
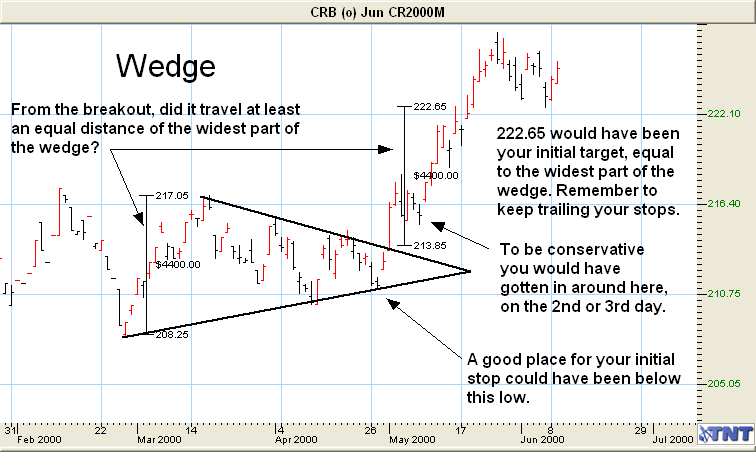
In the above chart, you can see that the breakout did in fact travel at least as far as the widest part of the Wedge. This is common and you should use this fact in determining your profit target. Sometimes the price will continue, and you could consider adding contracts at that point.
Flags & Pennants
Flags and Pennants look very similar and can be treated the same. One looks like a sloping rectangle and the other looks like a small symmetrical triangle.
They are some of the most reliable formations you will find and almost never represent a reversal in the trend, only a pause in the trend.
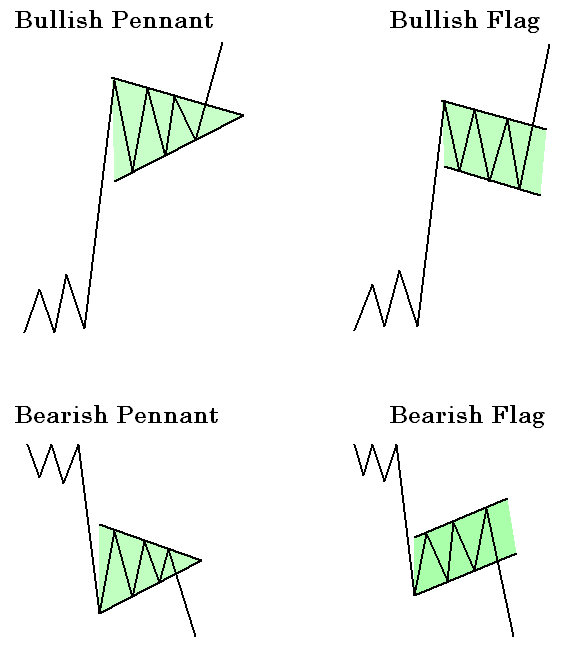
Look at the diagrams below to see what they look like, and then we will look at some on a chart.
Keep in mind that volume should be light in the formation stages of both Flags & Pennants. A Bull Flag as shown below should have heavy volume on a breakout to the upside. Heavy volume is not required for the breakout of a Bear Flag.
Notice in the following chart, there was a little increase in volume at the breakout, but I think this was due more to the Gap than the breakout.
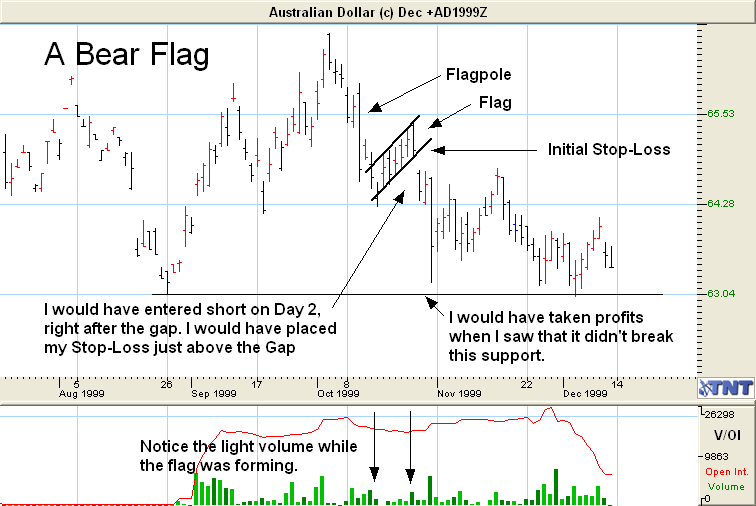
Notice that the distance the price dropped was almost the exact distance as the flag formation that preceded it. You can use that knowledge as a place for your target to take profits, or to add contracts if it is exceeded. Always trail your stops!
What appears to be a flag, sometimes turns out to be an ascending or descending channel. Be very careful if the flag portion of the formation exceeds the “flag-pole” portion of the formation. Also, you might see a gap in the opposite direction. If so, be very careful as it means the formation did not hold.
Let’s look at some other Flag and Pennant formations on the next charts and see how we could trade them.
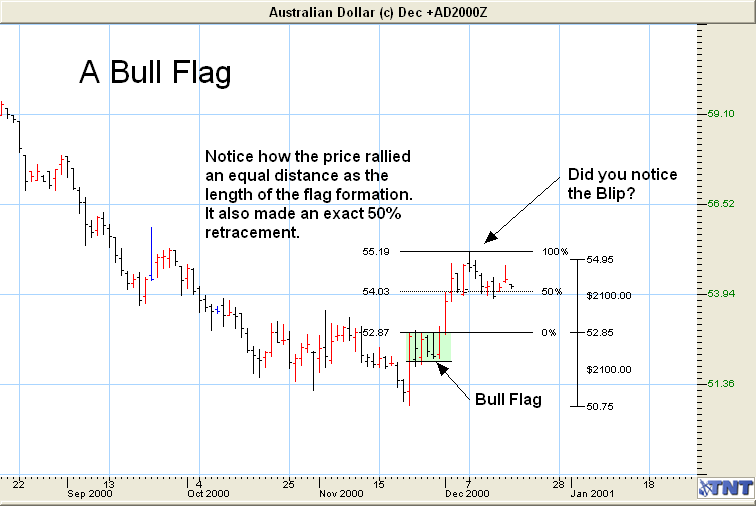
It’s important to notice that this one also rallied an equal distance as the length of the flag. It also retraced to exactly the 50% level. Interesting!

By now you should have a good idea how to trade these. The second flag on the above chart lead Crude Oil to all time highs of over $50 a barrel!
Also, notice that the price traveled at least the same distance from the breakout point as the length of the flag. This would be a good place to take profits or add contracts.