Common Threads
Everyone agrees that there are two types of patterns; the Reversal Pattern and the Continuation Pattern. In this lesson we are going to cover Reversal Patterns and in the next lesson we will cover some Continuation Patterns.
Of course a Reversal Pattern means that the trend should reverse. Keep in mind that several things will help you “confirm” these price patterns. Volume is a key indicator.
There are some common threads or rules that usually take place on any major reversal pattern.
- There must be heavy volume on an upside breakout.
- An important Trendline may be broken.
- Tops are often shorter in duration and will have more volatile price swings. They also have wider daily price ranges than bottoms.
- Bottoms tend to take longer to form and are not as volatile as tops. They usually have smaller daily price ranges than tops.
- The bigger the pattern, the further the prices will move out of that pattern.
Volume: Volume is critical in an upside breakout. You will seldom see a true breakout to the top of a formation unless there is heavy volume along with it. So anytime you see one of these major formations break to the upside, watch and make sure the volume is increasing along with it.
At market tops, you might not see the heavy volume at first when it breaks to the downside. Even though it’s nice to see the volume pickup when it breaks to the downside, it’s not as critical as in a breakout to the topside.
Broken Trendlines: More often than not, a major trendline will be broken. This does not mean that the trend will reverse when this happens but it does mean there is a “change” in the trend which could result in a price consolidation or the beginning of a Channel or a Trading Range.
Tops: Tops form faster and are more volatile than Bottoms for some reason. They have wider ranging days and many times have less volume so you don’t get good fills. Now that’s the “bad” side of Tops. Want to hear the good side? They usually fall like a rock and sometimes very quickly. So if you are short the market when a top does reverse you can make very good money.
Bottoms: Bottoms usually take a long time to form and are usually far less volatile than Tops. You can get better fills when they do reverse because the price range is usually not as great as Tops and they are not as volatile. Bottoms are less risky to trade than Tops too since they move slower.
Keep this in mind; prices fall a lot faster than they go up in most cases.
Pattern Size: The larger and longer the pattern, the greater its importance. Example; a trendline that’s a week old that gets penetrated is not nearly as important as a trendline that’s two months old that gets broken. Also, the height of the pattern is important. For example, a Narrow Sideways Channel that breaks out of its trend is not as important as a Trading Range that breaks out of its trend. So keep size and time in mind when looking at these patterns.
The 123 Method – Some Hate It & Some Love It
123 Formations are some of the most controversial chart formations you can find. Either people love to trade them or think you are crazy if you do. If you can learn to spot them correctly and wait until they confirm themselves, I think they can be a GREAT trading formation. 123’s would be classified as a major reversal pattern.
Wouldn’t it be nice to be able to know in advance where the price is headed when looking at a chart? Is it going up? Is it going down? One way that works more often than not is called a 123 Top or a 123 Bottom. These are just a technical analysis of a chart that can show you a trend reversal that may take place.
Remember talking about support and resistance, when the price hits a certain level and then bounces back? That’s what a 123 formation is, a series of support and resistance levels. Let’s take a look at an actual 123 Top that took place and then we’ll look at a 123 Bottom also.
123 Tops: Look at the next chart. Do you see the top price paid during this contract? It’s 190.00 back in April 2004. That’s your #1 Top. (Each contract can have only one #1 Top and one #1 Bottom at any specific time, which is the highest price and the lowest price during that contract period).
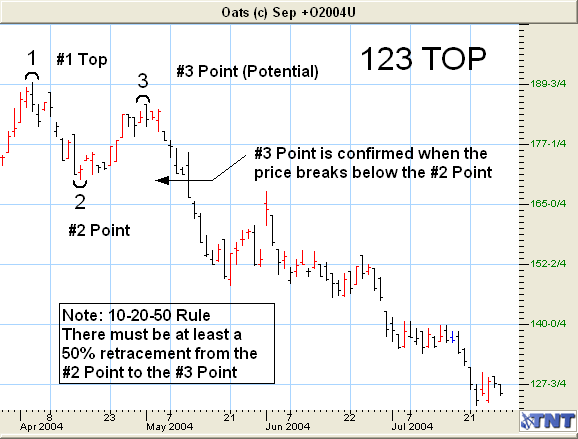
As you can see, the price started dropping and continued its downtrend. On April 16th it reversed trend again and headed up. This reversal point is now the #2 point. (The #2 point was formed when the price reversed direction and headed back toward the #1 point). If it continues to climb and exceeds the “old” #1 point, then it forms a new #1 top at its peak and we start all over waiting on a new 123 Top to form.
The potential #3 point is formed when the price rallies toward, but does not exceed, the #1 point and then reverses trend again and heads back toward the #2 point. The #3 point is confirmed when the price breaks below the #2 point. Look at the chart again. See when the price declined from the #3 point and then continued past the #2 point on May 12th? When it passes the #2 point then that confirms the 123 Top formation. If the price did not break the #2 point or if the price rallies (goes up) and makes a new #1 top point, then we start all over.
The previous #1 Top would no longer be the top price paid during that contract if the price rallied and made a new high. You would want your open order to go short below the #2 point and your stop loss above the #1 point if the trade meets your risk reward ratios. If not, consider placing your stop above the #3 point to reduce your risk, but you also increase the odds of being stopped out early.
The 10-20-50 Rule: In trading a 123 formation, either a Top or Bottom, there are several points you need to look for. Firstly, there should be at least 10 trading days, but not more than 20 between the #1 point and the #3 point. Also the #3 point should have at least a 50% retracement of the distance from the #2 point to the #1 point before it turns around and breaks the #2 point. This means that the #3 point should go at least half the distance between the #2 and the #1 points before it turns around and breaks the #2 point. As a matter of fact, the closer the #3 gets to the #1 point the better. This just makes the #1 point that much stronger, since the price tried to break through the #1 point but couldn’t.
On the previous chart once the time and retracement were confirmed, you would have wanted to place an entry order (sell stop) to ‘sell a contract’ or go short on a price break just below the #2 point. And also place your stop loss order (buy stop) just above the #3 or #1 point.
123 Tops and Bottoms can be a very good way to see a trend reversal taking place. Now, let’s learn about 123 Bottoms.
123 Bottoms: 123 Bottoms are as the name implies, the opposite of 123 Tops. We want to look for a contract low (the lowest price on the Daily Contract). Remember, there can only be one #1 Bottom on a chart. So let’s take a look at a 123 Bottom formation on the following chart.
Do you see the lowest price reached on the contract? At the end of April? This is the #1 Bottom formation. Notice that the price rallied the next two days and then dropped back again almost to the #1 bottom Point. I would count this as a false 123 forming, as there was just not enough time between the #1 point and the first #3 point. I would then look for a new #2 point to form, which it did about a week later.
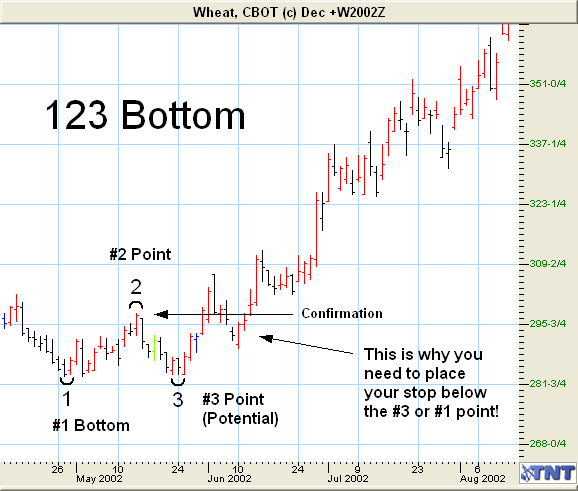
Now we have a new #2 point that formed at the end of the second week of May. I’ve labeled this as #2 on the chart. Then a week later the #3 point was formed when the price dropped down to about 284 and then headed back up again. The #3 point was confirmed when the price broke above the #2 point. You’d have wanted to place an open order to go long, just above the #2 point at, say, 299.
The second 123 proved to hold true and it would have been a profitable trade. Also notice that it met all three of the rules. (10–20-50)
Keep in mind that the 123 formations must “look” right. Trading is an art, not a science and each and every one of us will see things a little differently. That’s okay, too.
The same rules apply to both Tops and Bottoms. Like I said earlier, it’s good to see 10 days, but not more than 20 days, between the formation of the #1 point and the #3 point reversing, and then exceeding, the #2 point. The closer the #3 point retraces towards the #1 point, but does not exceed it, the better, and this one was just about as close as it gets! Remember, it must retrace at least 50% or more before it “looks” right.
Of course, if the #3 point falls below the #1 point at any time, then we have a new #1 bottom and we start looking for the 123 Bottom to form all over again.
Taking Advantage of The 123 Tops and Bottoms: Now that you know what a 123 Top and a 123 Bottom look like, let’s learn how to take advantage of them when they do form. I almost always trade the 123’s as long as they meet the 10-20-50 rule and have the proper Risk/Reward ratio.
Earlier we learned how to get the 50% levels of the Daily, Weekly and Monthly charts. When you see a 123 Top or Bottom being formed, go ahead and do a 50% level on the Weekly and Monthly chart, as well as the Daily chart, to get an idea where the price may eventually head.
My first target is the 50% level, whether or not it is the 50% level of the Daily, Weekly or Monthly chart. It does not matter which one is first. It’s the first 50% level that I’m looking for as my initial profit target.
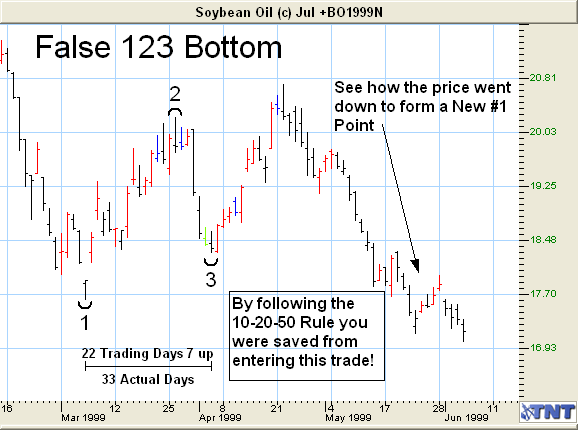
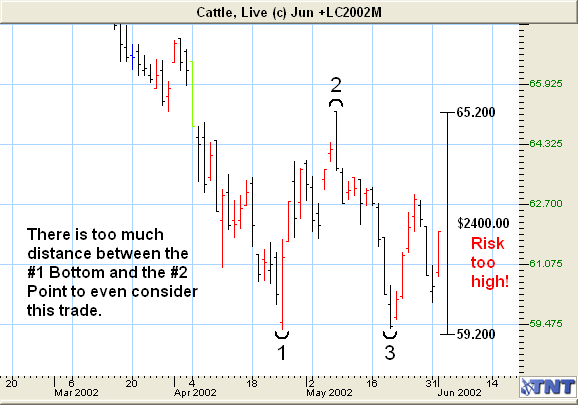
They Have To Look Right! Trading is an art, not a science and here is one place that proves it. When looking at any 123 formation, look to see how much “distance” there is between the #1 point and the #2 point. If it’s too “tall” you know there is a lot of risk. Why? Because your initial entry point is a break above/below the #2 point and your initial stop is going to be below/above the #1 point. Sometimes you can use the #3 point rather than the #1 point for your stop. It depends on the Risk/Reward ratio of the trade.
Look at the following chart and you can see that this 123 formation would not even be worth considering because of the distance between the #1 point and the #2 point is so great.
Reversal Days
An important tool for you are Reversal Days. These are also called, top or bottom reversal days, buying or selling climax’s, and key reversal days. They are all the same thing.
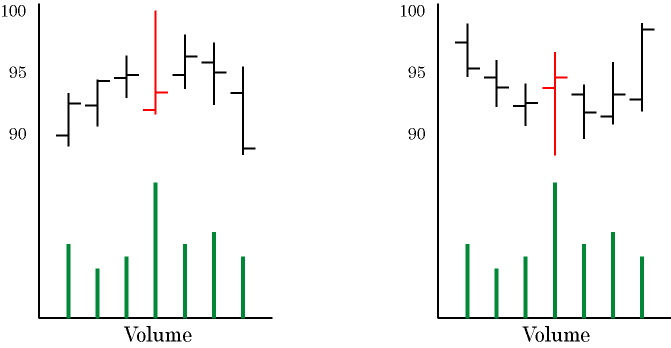
You will find these formations at the top or the bottom of a price move. In the case of a “top” you will see that a new high was formed that day but the price closed in the lower 25% of that days trading range. In a “bottom” just the opposite is true; a new low was formed that day but the price closed in the upper 25% of that day’s trading range. (The trading range I am referring to here is the range for just one day. In other words the high of the day to the low of the day)
When you see a reversal day take place there are two things you should look at. One is the width of the price movement that day. A day that ranges just 10 points is not nearly as strong as one that ranges 50 points. The other thing to look at is the volume (number of orders that day and you can find the volume on most of your on-line charts. The heavier the volume that day, the stronger the formation.
You should also look for the Reversal Day to be an outside day. An outside day simply means that the current day had a higher high AND lower low than the previous day. (See Glossary) Due to the nature of the formation being just a one-day formation, you must look at the charts each day to take advantage of them.
Watch where the price closes that day
Watch for heavy volume that day
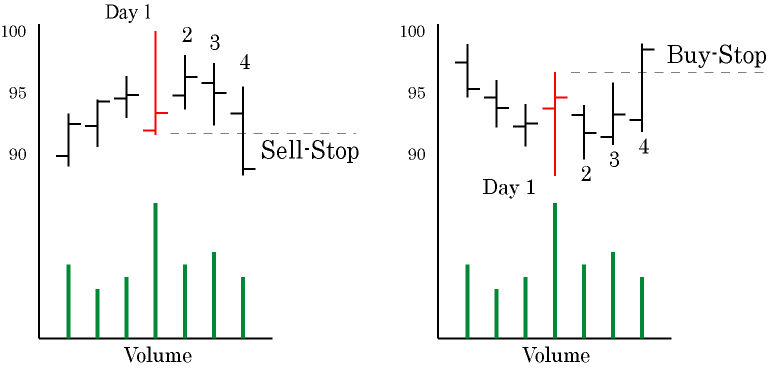
The way that I like to trade them is to place a Sell-Stop order, in the case of a top day, below the low of the reversal day. I may miss a few points profit by not “buying at market” the next day, but I have found that I had rather miss a few points profit and make sure I’m on the right side of the trade.
In the case of a bottom day, I would do just the opposite and place a Buy-Stop order just above the high of the reversal day.
I would not use a Limit Order or a Market Order on either one of these trades. I would only use a Sell-Stop or a Buy-Stop order.
This way the price has to do exactly what I want it to or I don’t get filled.
I don’t like to use Open Orders very often as they are easy to forget about. If you recall an open order just sits there until it’s filled. It might be days, weeks or even months later when it gets filled and this is NOT what you want.
In the examples above, the Reversal Day is Day 1 and I would place my Buy-Stop or Sell-Stop order before the market opens on Day 2. I would only use a day order so if it’s not filled that day the order is cancelled. If I didn’t get filled and the market continues to reverse like it did in these examples, I would then place the same order on Day 3 or Day 4. I would keep doing this until it is filled provided the market is going in the direction I want it to.
The dashed lines above show where my order would be filled; “just above or below” the high or low of the Reversal Day. Keep in mind that only a few of these Reversal Days become Key Reversal Days in which the market does change direction. By placing your orders as I discussed you will be kept out of many of the trades that didn’t go where you wanted them to.
Later in the course, you will learn to tie together other technical indicators when looking at these to improve further your chance of making a good trade.
Two Day Reversals
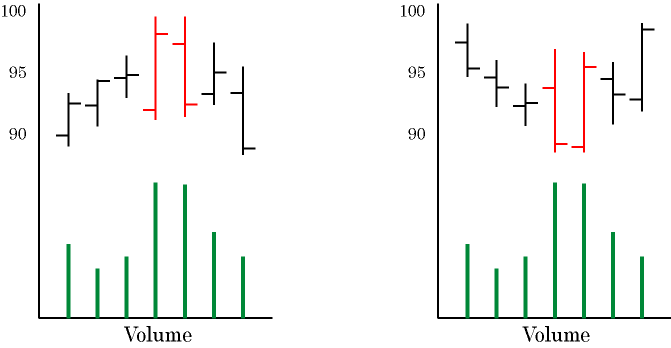
You will find that sometimes it takes two days for this reversal to form rather than one day. What happens in a “top” is just like in a one-day reversal, prices set a new high and they close in the top 25% of that days range.
Now the next day, the price may open near to the close of the previous day but drop like a rock from the opening price and close near the bottom of that days trading range.
Of course the opposite holds true in a “bottom” two-day reversal. Lets take a look at the following diagram to see what they look like.
Anytime you see a major turning point in the market you will probably see one of these reversal formations, or a Blip that we will review next. The trick is to know when it’s real and when it’s not. To do that you must also look at the other technical indicators that will be discussed later in the course. But do be keenly aware of them as many will turn out to be a reversal.
Blips
This is a very popular formation. Blips are a variation of the two reversal days you just learned about.
Look for Blips after a big rally or after a big downtrend. You could think about it this way, I’m looking for a major price reversal with a Blip. You can use the Blip to enter a trending market and we will also talk about that too.
I hope I have your undivided attention because what you are about to learn could provide you with a comfortable living if you learn to trade it correctly.
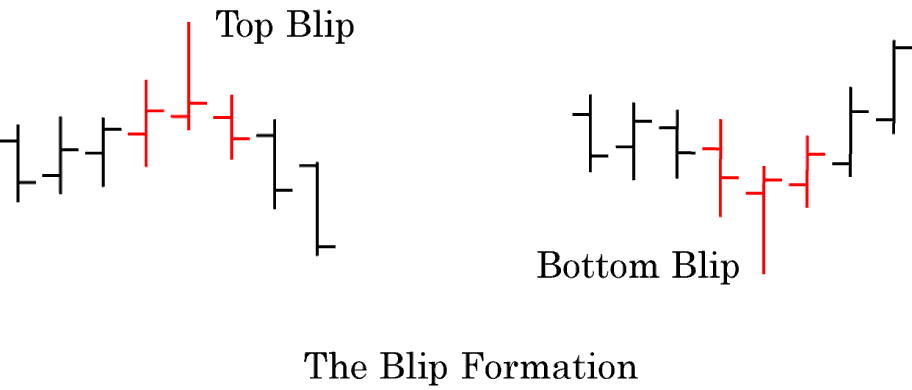
A Blip is when the price on Day 2 of a three-day formation is higher (for a Top Blip) or lower (for a Bottom Blip) than Day 1 and Day 3. Inside days don’t count when looking at these formations. Remember that an inside day is when the current day (the inside day) traded within the price range of the previous day.
Lets look at the following diagram to see how these actually look and then I’ll show you how I trade them.
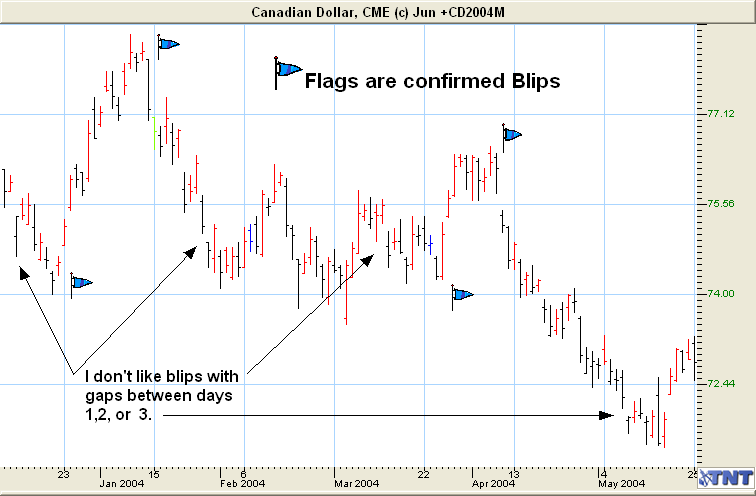
As you can see on the next chart, almost all the Blips represented a trend reversal. Some short term, lasting a couple of days and some long term over a few weeks, while others developed into a complete trend reversal.
Think of a blip as a three-day formation. When you see a three-day formation where Day 2 is either higher or lower than Day 1 and Day 3, then get ready to place an order.
Look at a Top Blip. On Day 2 it traded higher than Day 1 and Day 3 traded lower than Day 2. In other words, Day 2 has higher lows and higher highs than Day 1 and Day 3. When this takes place, you will often see a trend reversal and Day4 will fall below Day 3. Remember, Day 2 must have higher lows than Day 1 and Day 3.
The exact opposite is true for a Bottom Blip where Day 2 must have lower highs and lower lows than Day 1 and Day 3.
You might have a good idea how to trade these by now, but let’s look at it in detail. Blip days usually have a total of three days (not counting an inside day). I’ll call them Day 1, Day 2 and Day 3. In the case of a Bottom Blip, you would want to go long on Day 4, but at what price do you place your order? That’s a tough one, but this is what I do.
I used to use Limit Orders or Market Orders that were dependent upon where the price closed for the day, but I’ve found that I have better luck using Sell-Stop and Buy-Stop orders for trading Blips. Look at the following diagram.
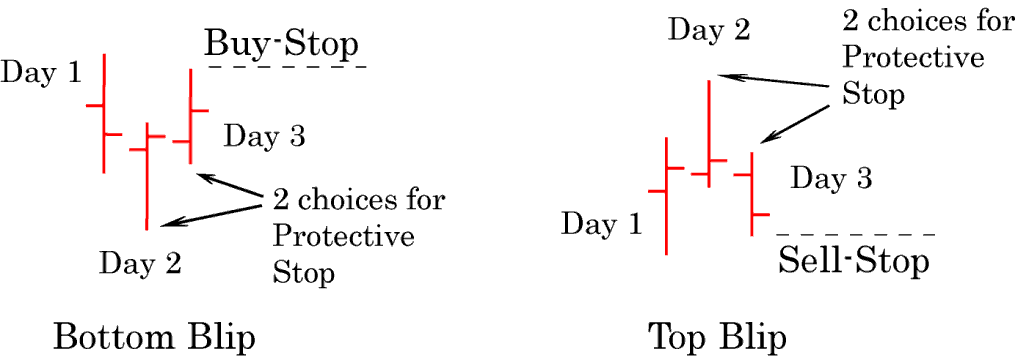
The first example is a Bottom Blip. You would place a Buy-Stop order just above the high of Day 3. You would have two choices of where to place your stops. One would be just under the low of Day 2 and the other would be just under the low of Day 3. You want to make sure that the protective stop is far enough out of the average days trading range that you don’t get stopped out during the day. But you also want to make sure that if you place your stop under the low of Day 2, that it meets your Risk/Reward Ratios.
The second example is of a Top Blip and you would place your orders and protective stop just opposite of a Bottom Blip.
Beware of False Blips! Sometimes you will get a false Blip. Look at the middle of the chart on the previous page, do you see where this Blip took place and then on Day 4 it dropped again? This is a false Blip. Notice that Day 3 of this Blip closed high, indicating that it would rally the next day. This one would have turned out to be a losing trade.
Placing your orders and your stops correctly are critical! When I place an order based on the Blip formation, it’s always a day order (good for that day only). Never place an open order (also called a GTC or Good Till Cancelled) order based on a Blip. The reason is that if the market does not do what you think it should do then you don’t want to be in the market. Although no one can make the market do what you want it to, you can always place your trades to coincide with what the market does. If you were to use a G.T.C. order, you might not get filled that day as the market did not follow the usual Blip pattern and went the other way. With an open order (G.T.C.) you might get filled several days later or several weeks later and that’s probably not what you want to do. Remember, a G.T.C. order just sits there waiting to be filled. It’s easy to forget that you have an open order for something and weeks later you get a call from your broker telling you that you were filled on an open order that you placed two or three months ago. Be careful with placing open orders.
Blip Reversals
Remember that I said sometimes Blips don’t always conform? In other words they don’t do what you expect them to. I call these Blip Reversals and once you understand what’s happening you can learn to trade them too. Let’s look at the following diagram to see what a Blip Reversal day looks like.
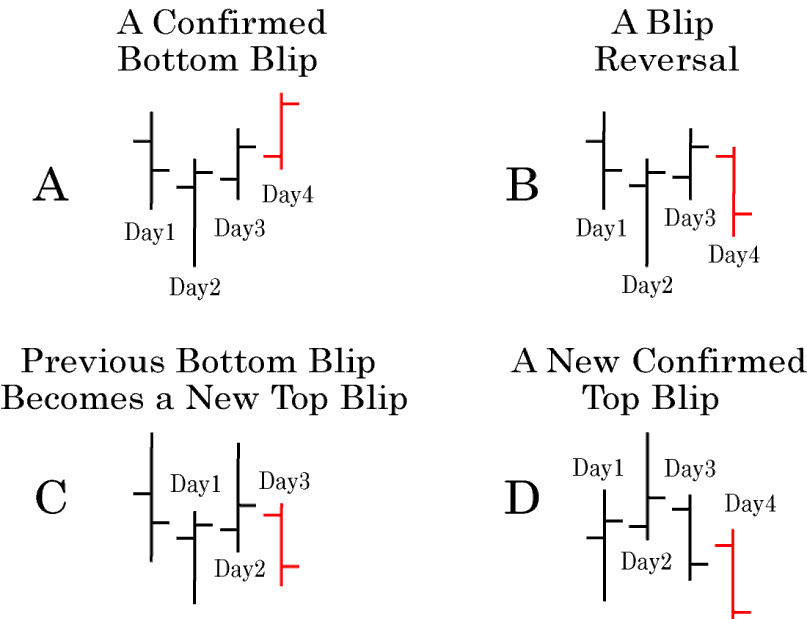
As you can see, Example A confirmed and did what we thought it would. If we had placed our Buy-Stop order above the high of Day 3, we would have been filled on Day 4. But what happens if Day 4 reverses and does not go above Day 3? Well, this is the Blip Reversal as shown in Example B.
In Example C, what was previously a Bottom Blip has now changed and become a new Top Blip! Now in Example A, if you had entered the market using a Buy-Stop order you would not have been filled and would have been kept out of a bad trade since the price did not exceed the high of Day 3 and your Buy-Stop order was above Day3. This is why I don’t like using Limit Orders or Open Orders on Blips.
An Alternate Way To Trade Blips
Now that you know we don’t live in a perfect world, I’m going to show you an alternative method for trading Blips.
Remember, we talked about bracketing a Channel or a Trading Range? You can do the same thing with a Blip. Look at the diagram below.
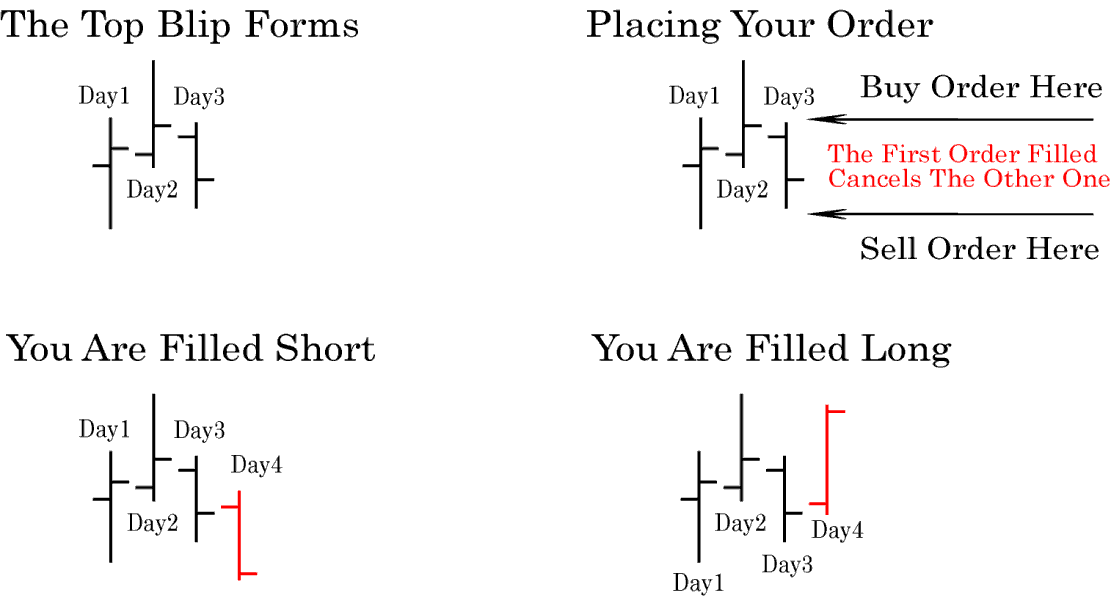
In the Example “Top Blip Forms” you see a possible trade here to short the market on the formation of a Top Blip. This is the “normal” way to trade these Blips. Now, here’s the twist on how to trade a Blip. You place two orders! Your first order would be to go short and place your Sell-Stop order below the low of Day 3. But, at the same time you place another order to go long above the high of Day 3. These would be an O.C.O. order (One Cancels the Other). So which ever order gets filled first, it cancels the other. This way you can’t have two orders at the same time. The only order you would have is the one that gets filled first.
Now, if you got filled short when the price broke below the low of Day 3 you are probably pretty happy because the Blip did what you expected it to do. It’s a win-win situation.
The question now, is, where do you place your stops? One thing you can do is tell your Broker that when one order fills, the other order becomes your protective stop loss order.
Blips On Weekly & Monthly Charts
Keep in mind that you will also find Blips on the Weekly and Monthly Charts. When you do, they are extremely powerful indicators and I always look for a way to trade them. Off the top of my head, I can’t think of any formation or technical indicator that is more powerful on a Weekly or Monthly chart than it is on a Daily Chart.
Many inexperienced traders don’t watch the Weekly or Monthly charts as closely as they should. Don’t be one of them. Watch them closely!
Head & Shoulders Formations
Of all the chart formations, the Head & Shoulders is probably the best known. It’s a major trend reversal pattern. Look at the Head & Shoulders top formation on the following chart. You can see that there are three parts to it. There are three “highs” on the chart. These represent the head of the formation, or the top and then the lower highs on each side are the two shoulders.
Head & Shoulders only form after a major price move has taken place. They take several weeks, to several months to form on a Daily Chart and maybe several years to form on a Weekly or Monthly chart. Please note the neckline at the bottom of the formation. The neckline does not have to be straight across, nor do the shoulders have to be at equal prices.
Sometimes another pattern may resemble a Head & Shoulders formation, so be careful when looking at them. They are one of the strongest trading formations that you can find.
Head & Shoulders Top – On the chart below, look at the three “tops” formed over the period from March to June 1998. The top created in March is the left shoulder, the center top in May is the head, while the right shoulder is the top formed in June. The formation took about 3 months to form on this Daily Chart of Cocoa.
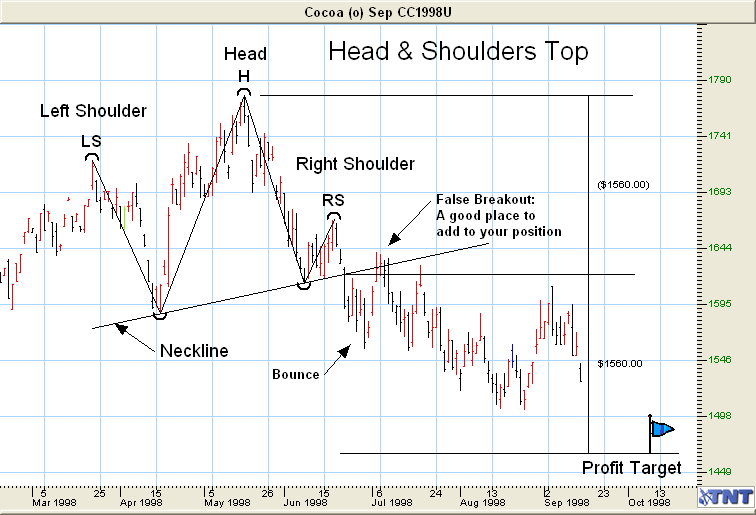
Look at the neckline. You would draw this neckline from the bottom of the left shoulder through the bottom of the right shoulder. It does not have to be straight across to form the neckline as almost all necklines are angled.
In a top Head & Shoulder Formation, you would place your order to go short below the neckline of the right shoulder and place your stop at a resistance level above it that would meet your Risk/Reward ratio.
Once the neckline is penetrated, the price should move a distance that is equal to the distance from the Head to the breakout of the Right Shoulder. In the above example, I used the Gecko Risk/Reward tool to see where my target should be once the breakout occurs. As you can see the price has come close to the target, but it has not hit it yet.
Often the Right Shoulder will do a 50% internal retracement towards the Head. If it does, I like the formation even better. Remember studying about this in an earlier lesson? It’s just an internal retracement again. This also applies to a Head & Shoulders bottom as well, and we’ll take a look at one of them next.
Keep in mind that the Neckline should not be broken or it violates the whole formation. Notice here that the price actually penetrated the neckline 3 times, and we had a one-day false breakout of the neckline but it closed that day below the neckline, keeping the formation intact. In lesson 2 you learned what it takes to break a trendline, and the same rules apply here too.
The Bounce: In most cases once the neckline is broken the price will continue in that direction but will often bounce back and touch the neckline again. Notice it did exactly that on this chart. Once the bounce takes place and the price touches the neckline again but doesn’t penetrate it, it’s an excellent time to add more contracts to go short as it means the formation is holding.
Head & Shoulders Bottom – This is the exact opposite formation of the Head & Shoulders Top. Look at the following chart. Where would you place your order to go long? Where would you put your stop-loss order?
Now, assume that the neckline gets penetrated on the following chart. What is the distance between the bottom of the head and the penetration of the neckline? This distance should also be the target on the upside as most times the price will travel past the neckline to almost an exact distance from the head to the neckline before it stops.
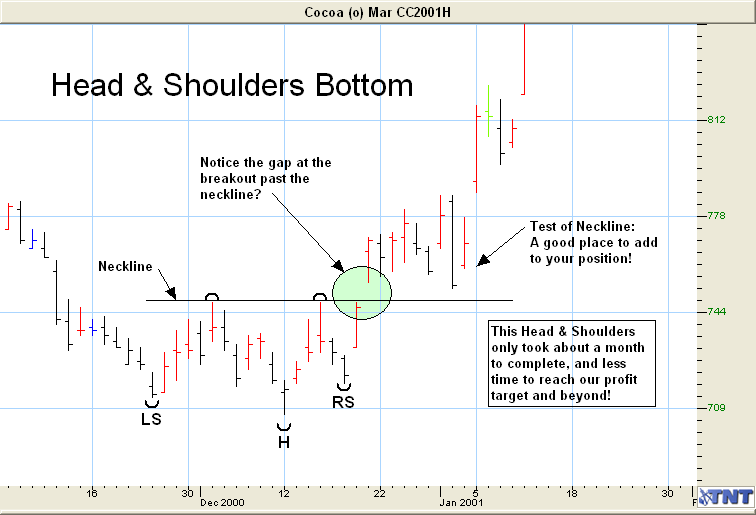
Just like in the Head & Shoulders Top formation, expect to see a “test” of the neckline take place. This is an excellent place to add contracts.
Many times, you will see a Breakaway Gap occur on the day it breaks the neckline on both top and bottom Head & Shoulder formations. Pay close attention to this.
V-Tops & V-Bottoms
A “V” Top or a “V” Bottom is where the market turns abruptly in the other direction without most other indicators showing that it’s going to do so. They are one of the hardest formations to trade correctly, since you can’t anticipate a trend reversal until it has already formed.
You can look for Blips on charts and after a few days, many will turn into a V-Top or a V-Bottom.
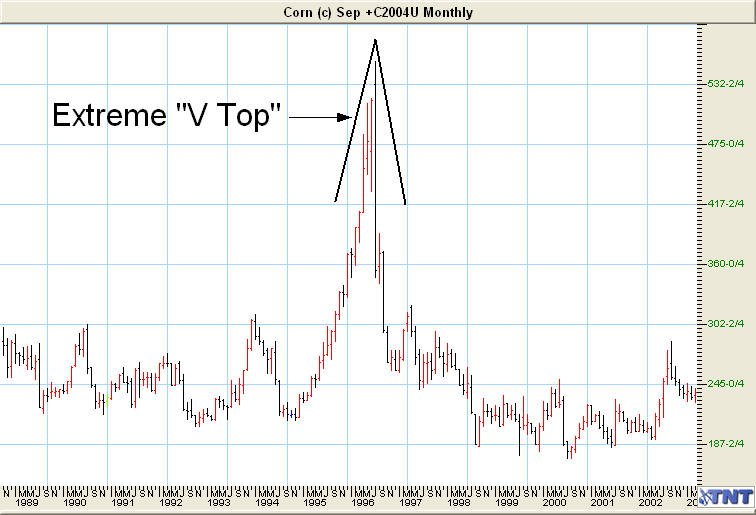
One thing that you can be watching for is a “runaway” trend. The market is trending for a long time, steeply in one direction many times when it turns it will be in a V formation.
Look for them after a rapid 50% retracement has been made that looks like it went “too far-too fast”. They just don’t “look” right. You will usually see open interest increase just before the V is formed. Just be careful when trading them!
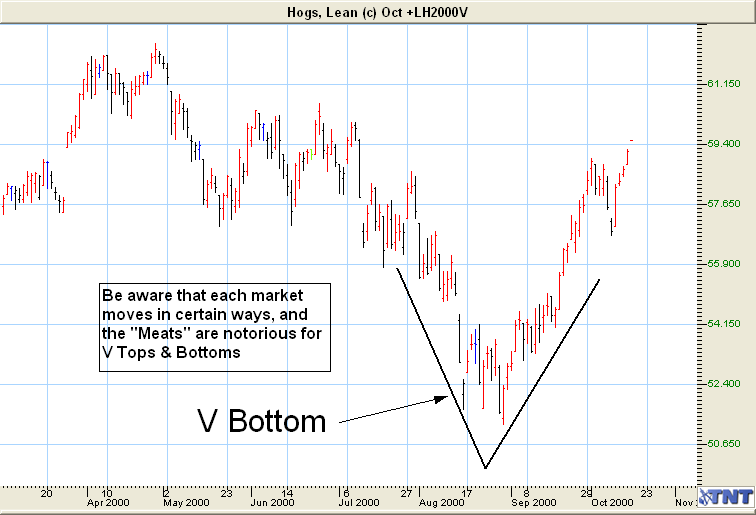
The above chart of October 2000 Hogs is a good example of a V-Bottom. Notice on the day of the trend reversal a Blip also formed.
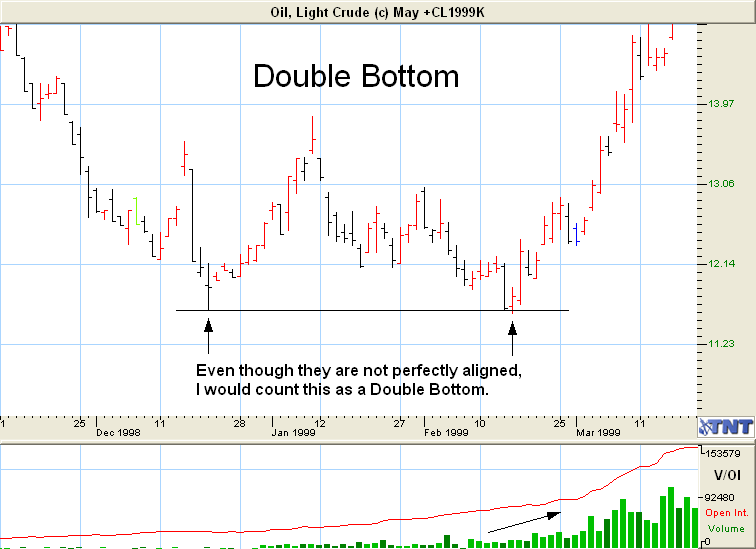
Double & Triple Tops
Double Tops are great to trade. You can also have triple tops, etc. A Double Top is when the price has made two highs at a similar price. The importance of a Double Top is that the market tried to break through the top of this formation on two (or more) occasions but couldn’t. It’s a very good indicator that the rally is over and a downtrend might follow.
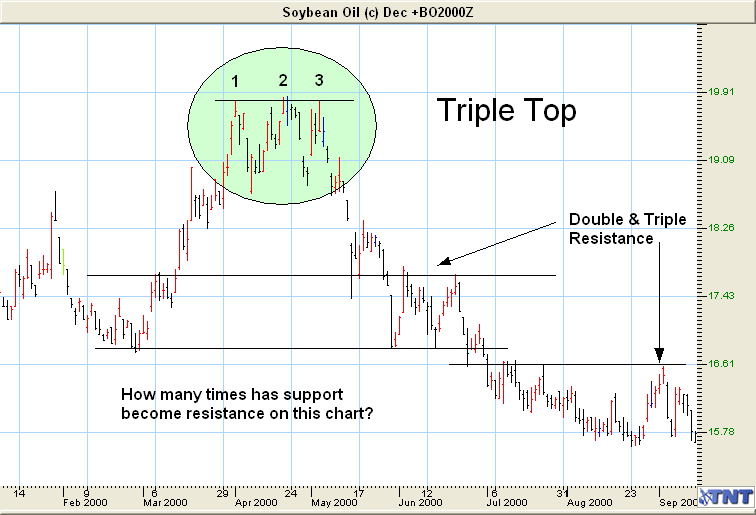
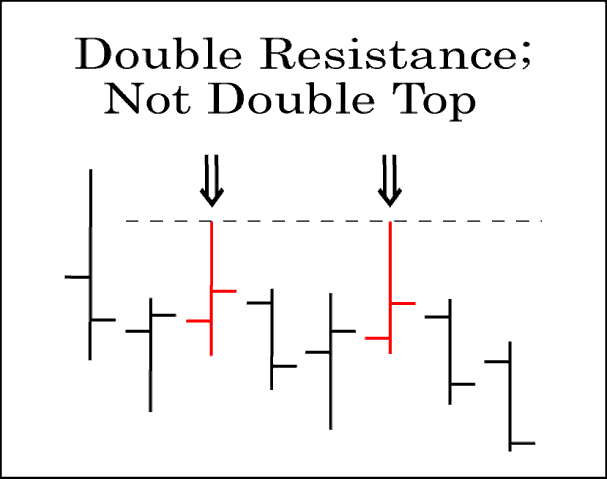
Double Tops must be the highest price reached during that contract period. If they are not the top price reached, then it’s not a Double Top but rather Double Resistance.
This is how I trade them. Usually, when the price comes up and hits the resistance level the second time, the third time for sure (making a triple top), I will go short as soon as it hits that resistance and starts to head back down.
Don’t short it the same day it hits the resistance level, as it might continue up and go through it. Place your entry order to enter the market below the low of the bar that tests the resistance. Then place your stop loss order just above the resistance level. This is one place you can keep very tight stops!
Look at what happened to June 2004 Crude Oil on the following chart when the Double Top was penetrated in October 2003? Could you have seen this coming? Of course you could and each $1 price move in Crude is $1,000 profit or loss.
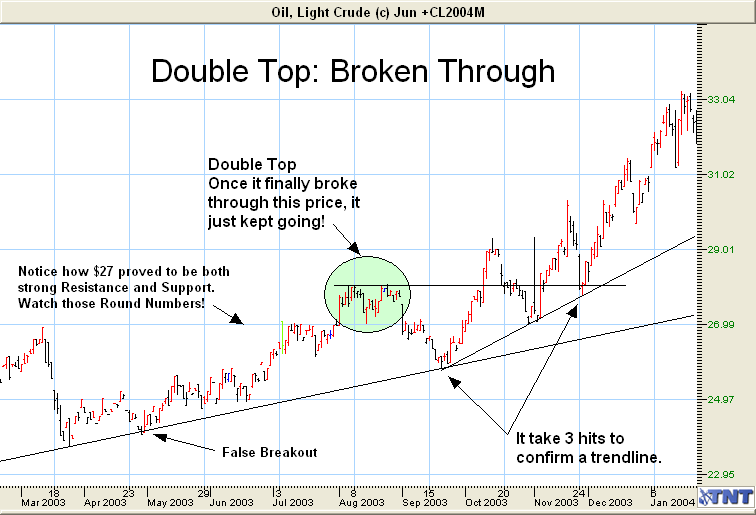
Once you have been studying charts for a while, you will look at them in a whole new light. Hopefully this is already starting to happen. Can you see some of the formations that we have already learned on the above chart? Could you have traded them correctly? Of course you could!
Double & Triple Bottoms
You trade these just like you would a double top, except you would be long the market once the price came down and hit the bottom again but could not break through it. You would place your order to go long after it bounces off the bottom the second time. You would place your stop just below the bottom support.
Here again is a place to keep tight stops. Remember to watch for heavy volume to take place when it hits the bottom and heads back up. You can’t have an upward rally that lasts very long without heavy volume to get it started.
Rounded Tops & Bottoms
Rounded Tops and Bottoms are also called Saucer Tops and Bottoms. They don’t happen often but they are a reliable formation to trade. When you think about it, it makes sense. The market slowly moves up and makes new highs and then slowly trends down again in the case of a Rounded Top. Of course for a Rounded Bottom, it’s just the opposite.
In the following example you could have traded it as a rounded bottom, or maybe as another pattern. Can you see another pattern which developed as well?
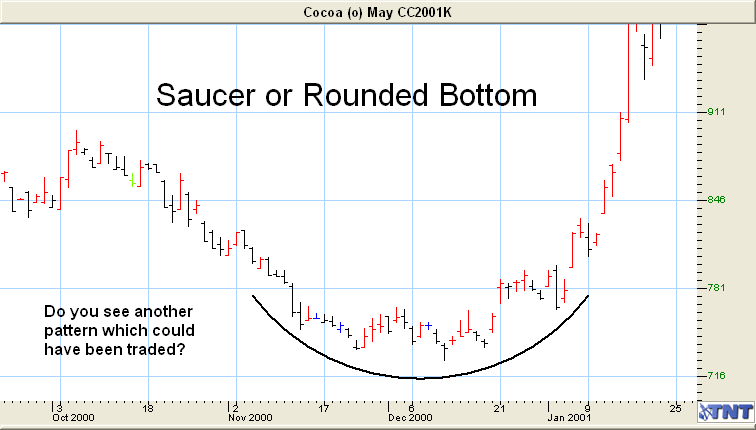
The best place to put your stop in the example above would be at a good area of support somewhere below your long entry. Place your stop just below that support level. Many times, it will be just below the low point of the rounded bottom. Remember to analyze your Risk/Reward ratios to see where to place your stops.
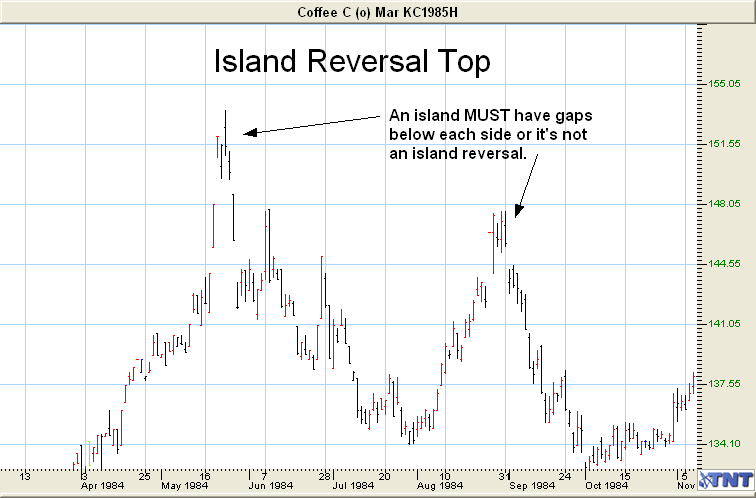
The Island Formation
The island formation does not happen that often, but when it does, it’s a very good indicator that a top has been reached and you would look for a trend reversal. The best way to protect yourself on these trades is to make sure that it really is going to be a reversal in price before you place your order. You would do this by placing a limit order below the gap after the island formed. That way, if the market does reverse, then you are in the market short from below the gap. If it turns out that the market rallies and sometimes it will, your open order to go short would not be filled and you could look at going long the market.
Remember to cancel your limit order to go short if it does not get filled or use a day order only.
You would place your initial stop just above the top of the island as long as it meets your Risk/Reward ratio, or at another resistance level that does meet it.