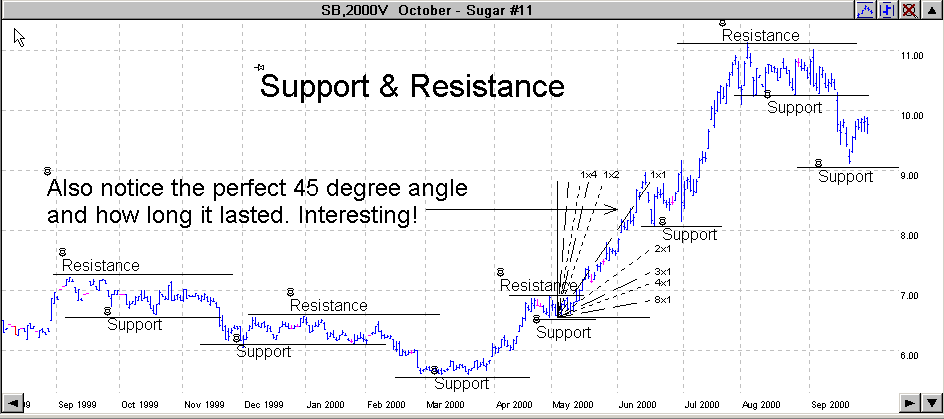
Support & Resistance Levels
Support and resistance are important terms to understand. They will play a major role in learning when and where to place your orders, when to get out of a trade and where you might want to place your stops. Think of support as the “floor” and resistance as the “ceiling.”
It’s important to understand that these support and resistance levels are there for a reason. It simply means that the price reached a point that it could not, or had difficulty, going through. This is why people refer to it as “resistance” when the price could not go above this point and “support” when the price could not go below this point.
For now, just understand that prices are like a rubber ball and they will tend to bounce between these support and resistance levels until they break through.
Also note that the 50% level is sometimes both a support and resistance level. Notice how several of the support and resistance areas bounce off the 50% level? This may seem uncanny, but it happens over and over and over again.
Now, let’s find some support and resistance levels on the following chart. Remember, support is the floor and resistance is the ceiling.
In this lesson, you’re going to be learning when to place some trades and where to place them. You will know how to read these charts and to understand many technical formations that take place, as well as how to take advantage of them. Soon you’re going to learn to use these support and resistance levels in placing your orders and your stops. For now, I just want you to be able to see them and label them. Open up a chart and draw the support and resistance levels yourself; just like I did on the previous chart. It may seem like a simple exercise, and it is, but it’s important to learn how to do it.
Market Corrections – Why They Happen
There are just three types of traders if you think about it. Those that are long, those that are short, and those that are uncommitted. The people who are long are of course those that have bought contracts while those who are short have sold contracts. Then there are those who have not committed either way.
Have you ever wondered why the prices sometimes just bounce up and down between these support and resistance levels? I’ll give you a common sense viewpoint.
How many times have you seen prices hover around a support area for days, weeks or even months and then all of a sudden the price starts to rally?
The people who are holding long contracts are very happy. The only thing they are regretting at this point is that they did not buy more when the price was lower. They are hanging around waiting for a small market correction (price to drop back) so they can buy additional contracts at a lower price.
On the other hand we have the people who were short the market. They are not real happy about this as they wanted the price to drop. About this time they are thinking they are on the wrong side of the trade and it might be time to get out with a small loss rather than risking even greater losses. But, they are waiting for the same market correction that the longs are waiting for so that they can get out at a better price and have a smaller loss.
The thing is that both the longs and the shorts want the same market correction to take place! Think about that for a moment. Both sides of the market are wanting the correction to take place, just for different reasons.
The other group, the “undecideds”, see that the market is taking off but they too want to see a price correction take place before they jump in. So now we have everyone, the longs, the shorts, and the undecideds wanting the price to reverse a little. Each one has a different motive however.
So you have everyone trying to push the price. That’s why you see these pullbacks. Now of course the opposite scenario holds true if you are in an uptrend and the trend reverses. Everyone wants the price to go back up a little for the same reason.
But…what happens if the price goes back down? Glad you asked. Previously we talked about the price going up and then dropping back down a little. This by the way is also called a “pullback” in prices. When everyone started buying contracts on this pullback that created another support area didn’t it. If this pullback continues and the previous support is broken then the opposite scenario takes place.
Everyone who was buying is now looking at it like they made a mistake and they want to get out of their long positions by selling their contracts. The shorts on the other hand wish they had not bailed out and want to go short again or at least add to their positions if they did not get out already.
This yo-yo effect is what keeps prices hovering around the trend line so much of the time. So keep in mind that when a Trend is deeply penetrated that it takes a lot of energy to do it. This is one of the reasons that the third time the Trend is broken it’s usually a real good indicator that the trend has changed direction.
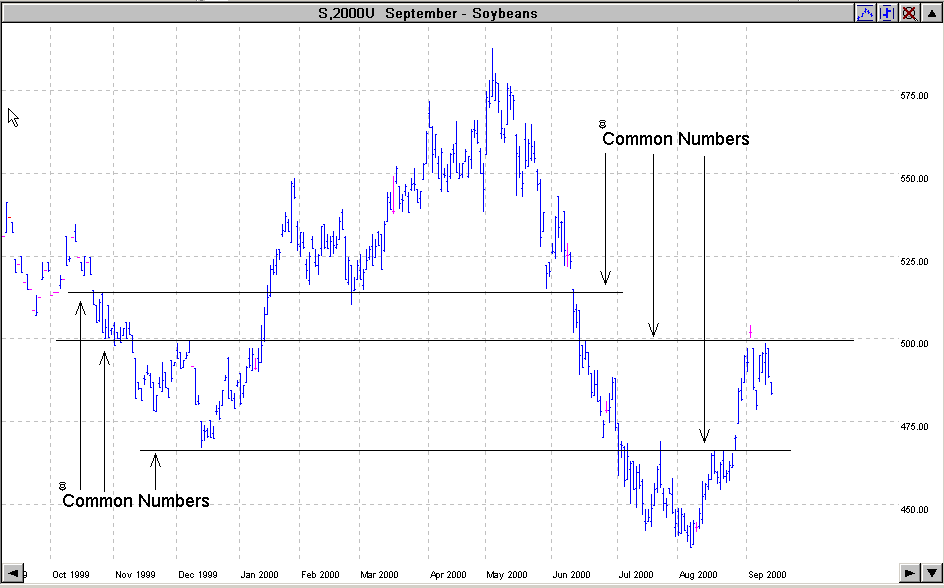
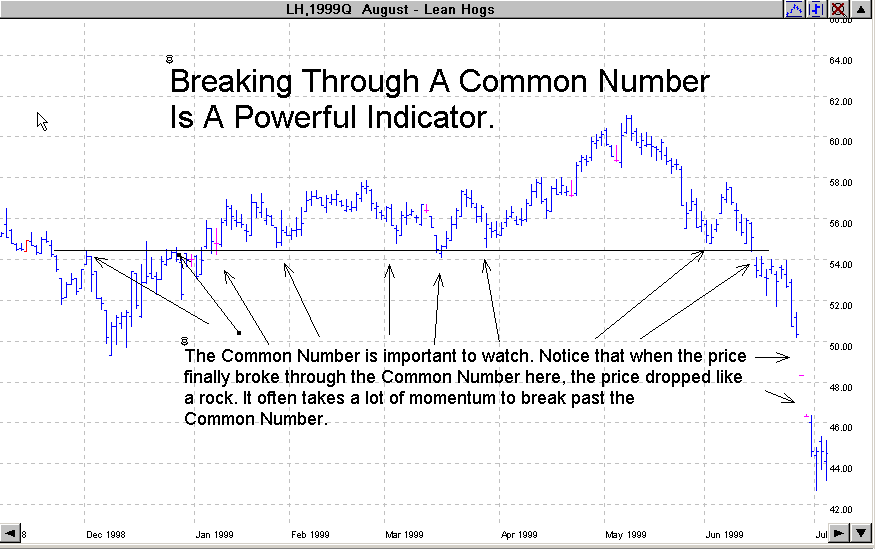
The Common Number or “CN”
Many times there will be a major Common Number or a “CN” on a contract. What I mean is, there is a specific price that will show both support and resistance several times during the contract over a long period of time. This is a very powerful indicator. Many times the 50% level becomes a CN too.
When looking at any chart, be sure to watch for any CN’s. It’s a very good place to either place your order and/or your stops.
Think about it for a moment. I bet you have already figured out several ways that you can use the CN indicator to place trades. Remember we talked about buying on support and selling on resistance. That’s really all we are doing here, except that the CN is a very powerful level of both support and resistance.
When looking for the CN, be sure to check the CN on the Weekly and Monthly charts too, as they are even stronger indicators than the Daily chart.
Go back to charts in the previous lessons and see if you can find some of these CN’s. How accurate would they have been as indicators?
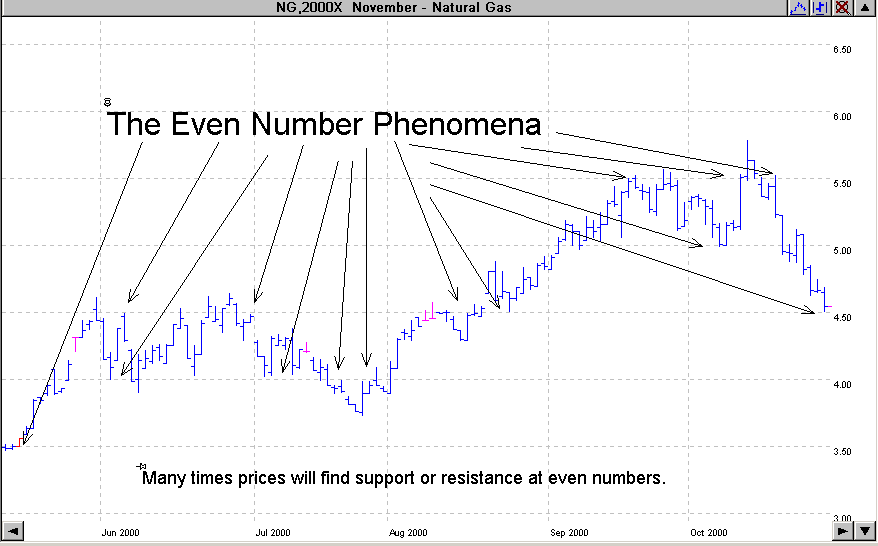
The Even Number Phenomena
For some reason prices tend to find major support and resistance at even numbers. Many times the price will rally or decline and stop at an exact even number. Many times it will be a multiple of 10; like 10, 20, 50, 100, 150 etc. I’m not sure why this actually happens. I’ve just noticed it many times on charts but go back to your own charts and see for yourself.
The question is, how do you use this information to better your trades. There are several ways to do this. One is in placing your stops. You should never place a stop at an exact even number. You should place it “just below” or “just above” an even number; especially if that even number is a multiple of 10.
Another way is to look at them for profit or exit targets. Think about it for a few minutes and I’m sure you will find other ways to use them too. A simple way to remember this is to always “be odd” when placing your stops.
Heading Home – The 50% Levels
The 50% level is simply the average price that was paid during a specific time frame and it’s simple to calculate. I call this price “home.”
To start, let’s do a 50% level on a Monthly chart on the Swiss Franc. This chart reflects the prices paid over the last 25 years.
You can see, the lowest price paid was in 1985 (34.00) and the highest price paid was in 1996 (90.00).
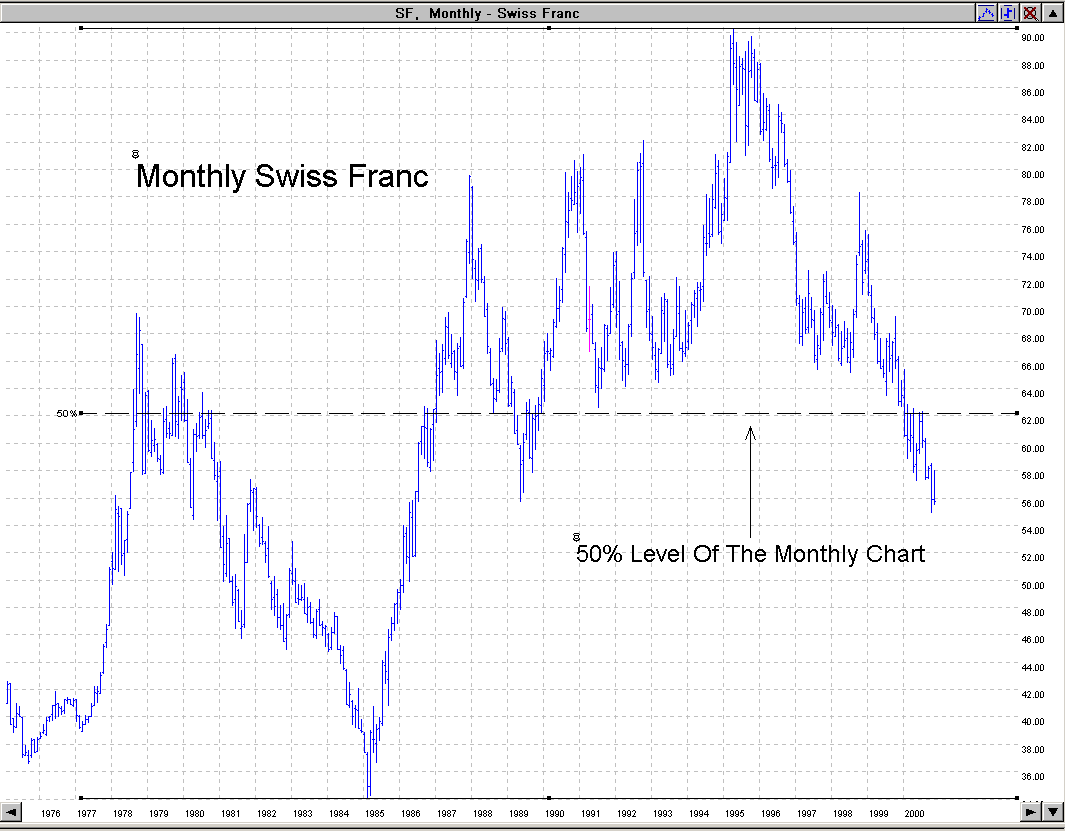
It’s simple to find the 50% level: just add the two prices together and divide by two. The low of 34 + the high of 90 = 124 / 2 = 62. So the 50% level of the Monthly Swiss Franc is 62.00.
This calculation does not have to be exact, as we are just trying to get a good idea of where prices have been and where they may go sometime in the future.
All prices will do a 50% retracement of their last major move. We just don’t know how long it will take for that 50% retracement to take place. What this means is that the price should turn around, or reverse its trend and then head back and meet or exceed the 50% level. Notice that the previous chart shows prices hovering around the 50% level on several occasions.
We can easily figure the 50% level and use it to our advantage. We can figure the 50% level on Monthly, Weekly and Daily charts. For long term trades, I always figure the 50% level on the Monthly chart first. This is where prices will eventually head. It may take months, or in some cases years, to get there, but it will always head there. It’s just a matter of time.
Next I figure the 50% level of the Weekly chart, then the 50% level of the Daily chart. I then plan all my long-term trades using these 50% levels as profit targets. Now let’s do the 50% level of the Weekly chart.
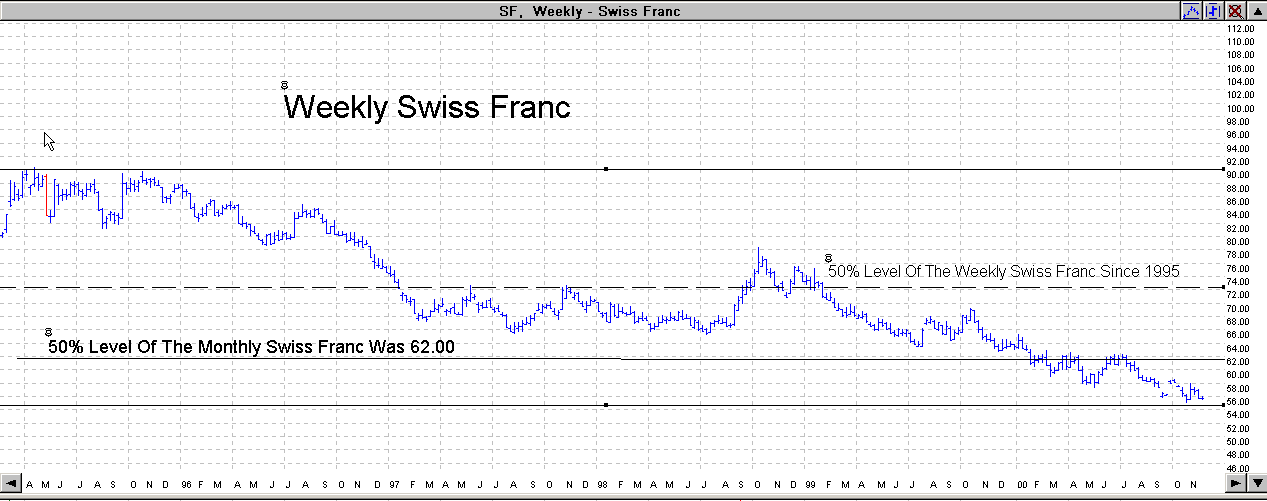
The highest price paid was 91.00 in 1995 and the lowest price paid was 56.00 in November 2000. We figure it the same way we did on the monthly. 91 + 56 = 147 / 2 = 73.50. So, 73.50 is the 50% level of the Weekly Swiss Franc.
Finally, let’s do the 50% level of the Daily chart below.
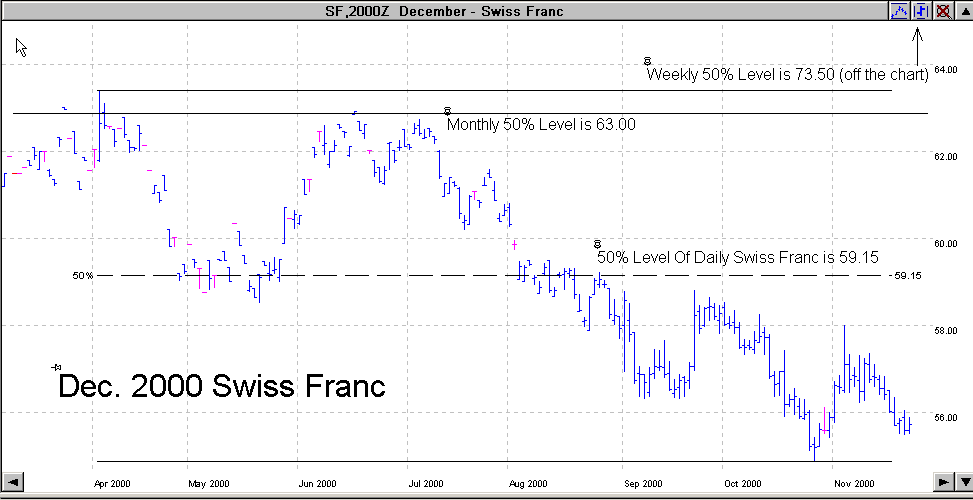
Without knowing anything else, it’s not hard to see that prices are at record lows on this chart. It’s only a matter of time before they head back up and do a retracement of 50% or more.
At some time, prices will do a 50% retracement of the Daily, then the Weekly, and then Monthly charts, but not always in that order. On the previous chart of the Swiss Franc, they would have to make a 50% retracement of the Daily, then the Monthly and lastly, the Weekly.
As you might guess, the key is to know when the price is going to turn around and head back towards the 50% level so that you can take advantage of it.
That’s the tricky part, but I’m going to show you later how to know more often than not, when this “reversal” might take place or at least when to be watching for it.
Internal 50% Retracements
Just like on the Monthly, Weekly and Daily charts you will find that prices make a 50% retracement within the short term as well. How can you profit
from this knowledge? Simple: by figuring the 50% level of the last major price movement.
Let’s look at the following chart to see how these 50% internal retracements work and then I’ll show you how to profit from them.
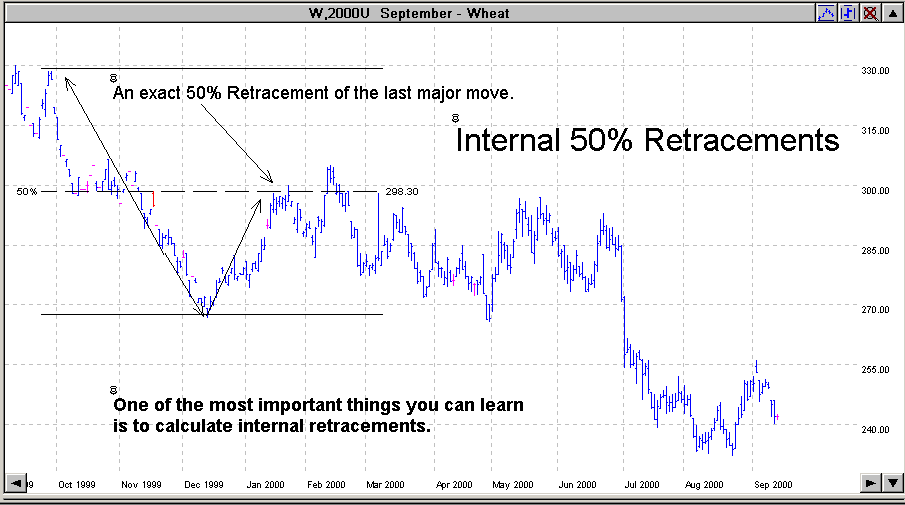
As you can see, the price of Sept 2000 Wheat on the chart above had a major price moved between October and December from 330 down to 270. I drew an arrow for you so you can see it more easily.
The important thing to understand is that almost all major price moves make at least a 50% retracement. I’ll show you what I mean.
The down trend on the above chart between October and December made an internal 50% retracement. Exactly 50% (back up to 300) as you can see. You will soon discover that 50% retracements happen over and over all the time. Whether it is a major move, like a Monthly or Weekly 50% level, or a major move like in the above chart, 50% retracements happen all the time.
Retracements that are not from a contract high to a contract low are called Internal Retracements.
I’m going to show you the same chart as above, September 2000 Wheat, in several views. I want you to notice how many times these internal 50% retracements took place. Many times they will make more than a 50% retracement. The point to remember is that most of the time, they make at least a 50% retracement before turning back around again.
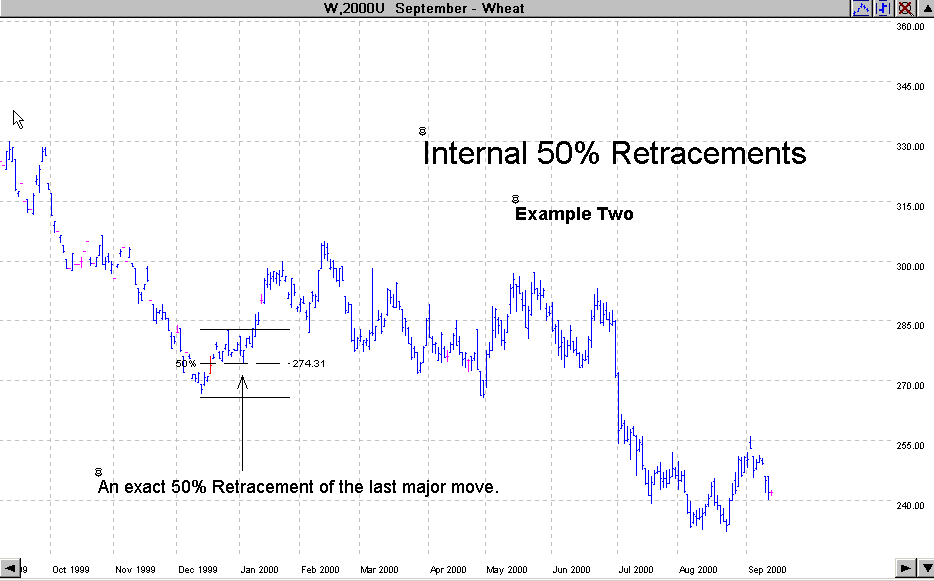
Let’s look at another example of the same chart again. This concept is important to understand. I will show you how to take advantage of it later.
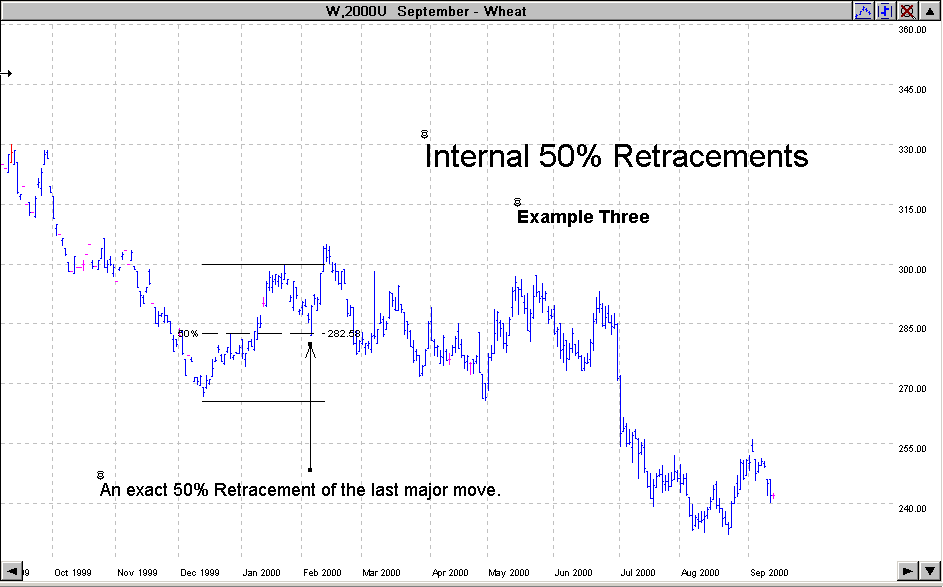
And another retracement on the following chart. This time it did make a 50% retracement and then some. Actually, it made a 62% and a 76% retracement on the nose and we will get into this in much more detail when we study Fibonacci Numbers in a later lesson.
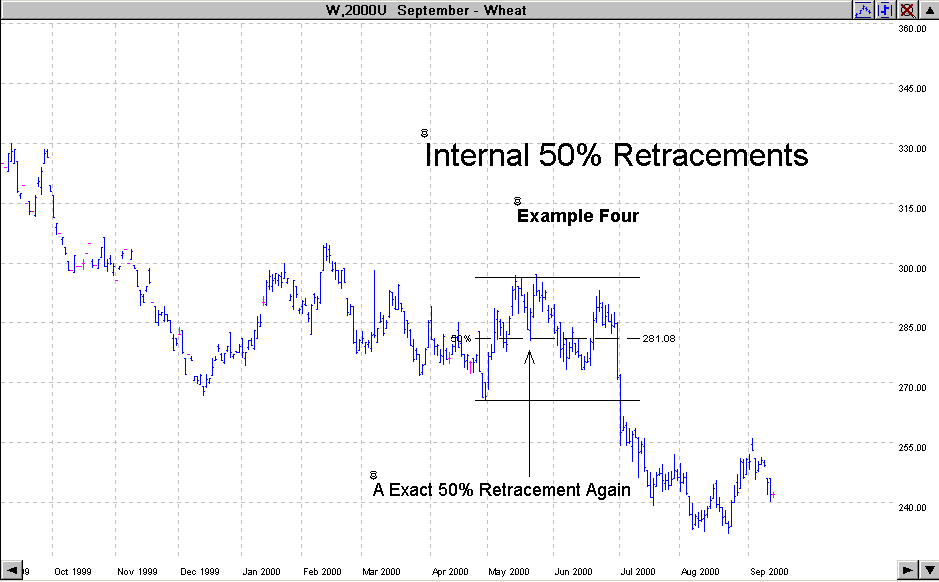
Are you starting to catch on to how important these 50% Internal Retracements are. If not, don’t worry about it too much right now. We will discuss it again in more detail later in the course. Right now, just be aware of them.
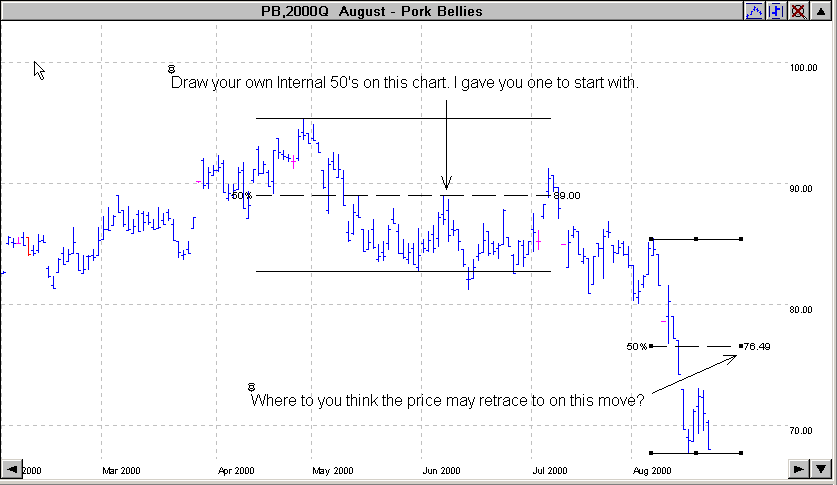
On the following chart I would like for you to draw out some Internal 50% Retracements that have already taken place. Then on the last major move that took place, do you think it might also make a 50%, or more, Internal Retracement? Get used to drawing these out on the charts. By the way, the Track N Trade software does this for you with just two clicks!