
The TrendBot EA is a directional trading robot that will greatly increase the profits that can be made from a given opportunity. In this lesson you are going to learn a few opportunities where the TrendBot EA can be applied. This robot can trade any opportunity but it is more suited for opportunities with larger targets on the Daily, Weekly & Monthly charts.
By trading larger opportunities, the robot has time to take advantage of the natural swings in the market during a trend by trading the same price multiple times.
The 50% Level: Heading Home
The #1 rule of technical analysis is that markets will return to the mean. This basically means that the price will retrace 50% of the prior major move, the only question is when.
The 50% levels can be calculated on the monthly, Weekly and Daily charts and at some point the market will head to that level.
Extreme Price Points
The chart below is a good example of a market heading back to the 50% level of the monthly range from an extreme price level. Anyone who knows Japan was fully aware that USDJPY at 76.00 was an extreme price level and once the reversal was made it raced back to the mean.
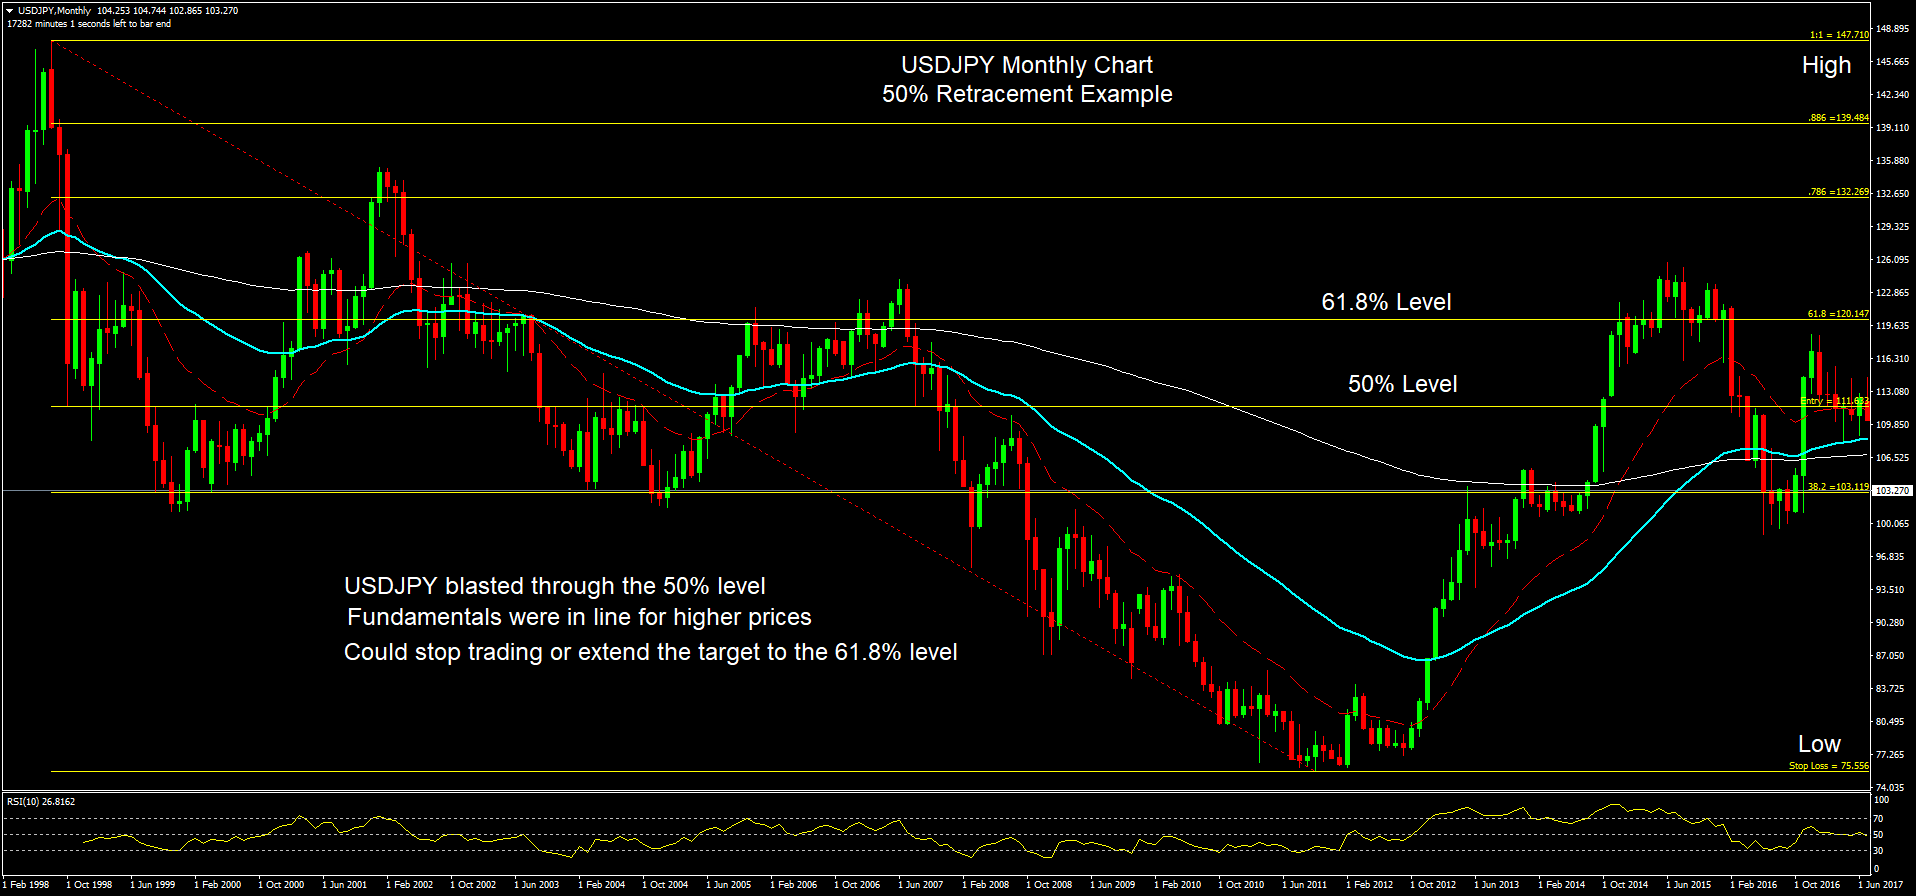
USDJPY Monthly Chart: 50% Retracement
The entire move took 3 years to reach the 50% level and another couple of months to reach the 61.8% level. The Weekly chart below shows the same extreme in price and how USDJPY hit the 50% level, then the 61.8% level, and finally moving all the way back up to where the drop began.

Click on the image to enlarge it
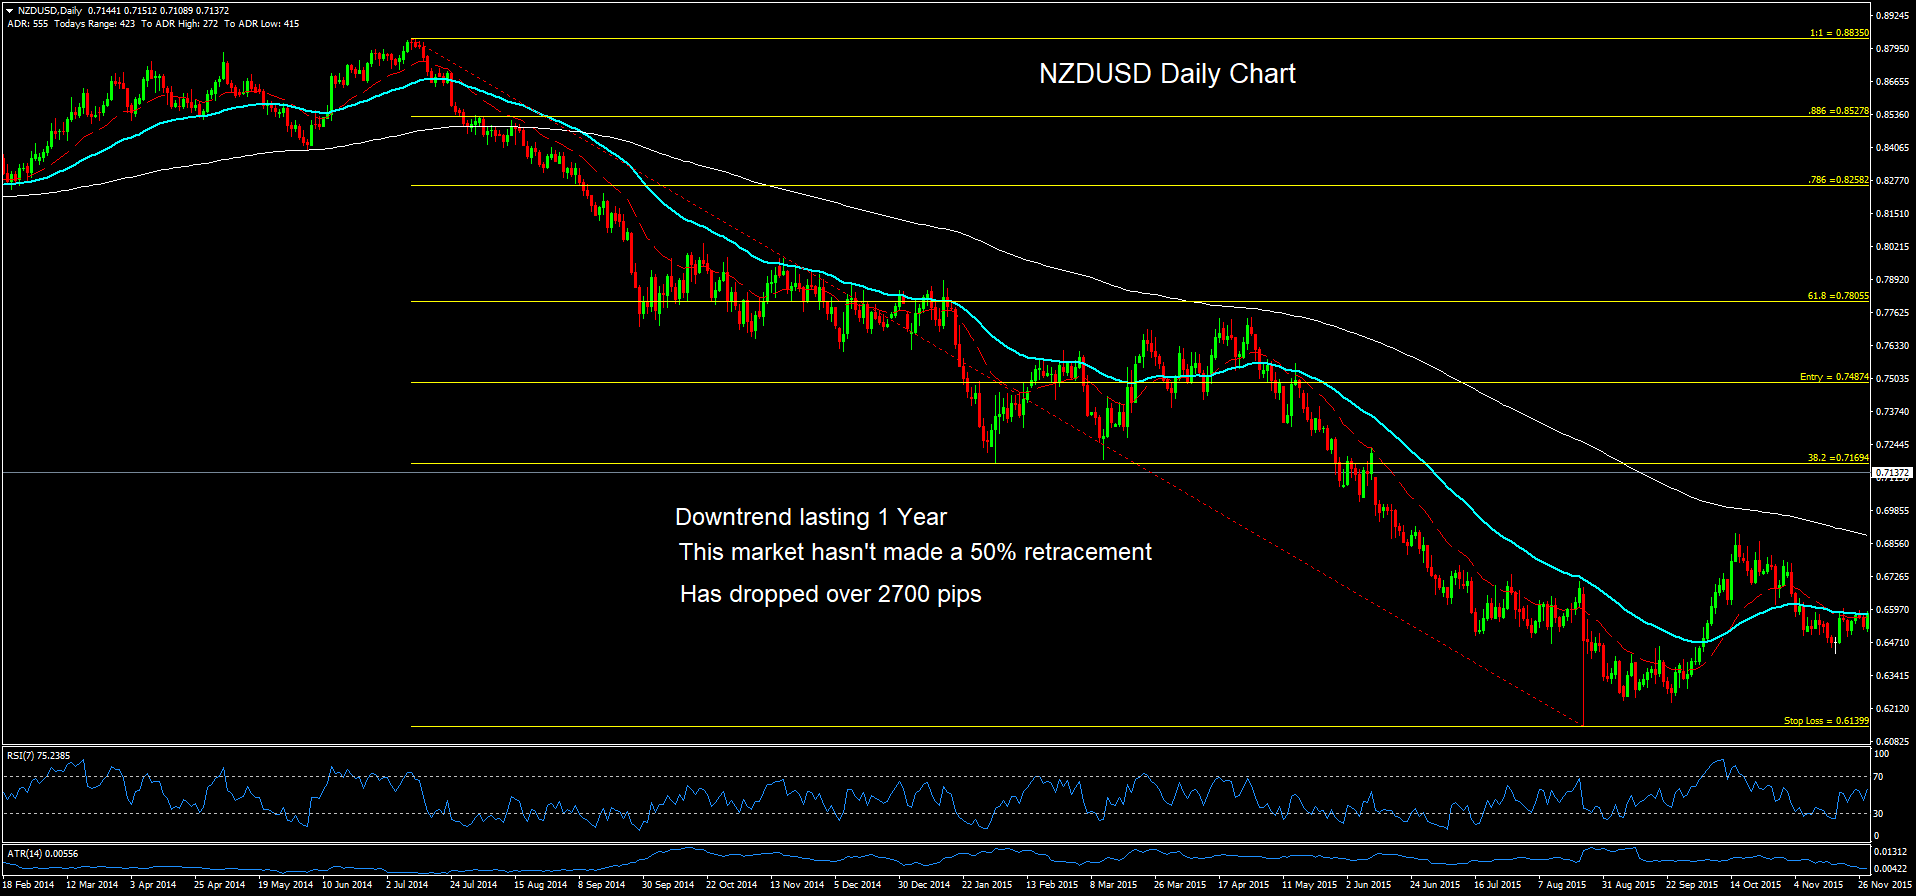
One of the best 50% levels to use as a target is one the market hasn’t completed yet.
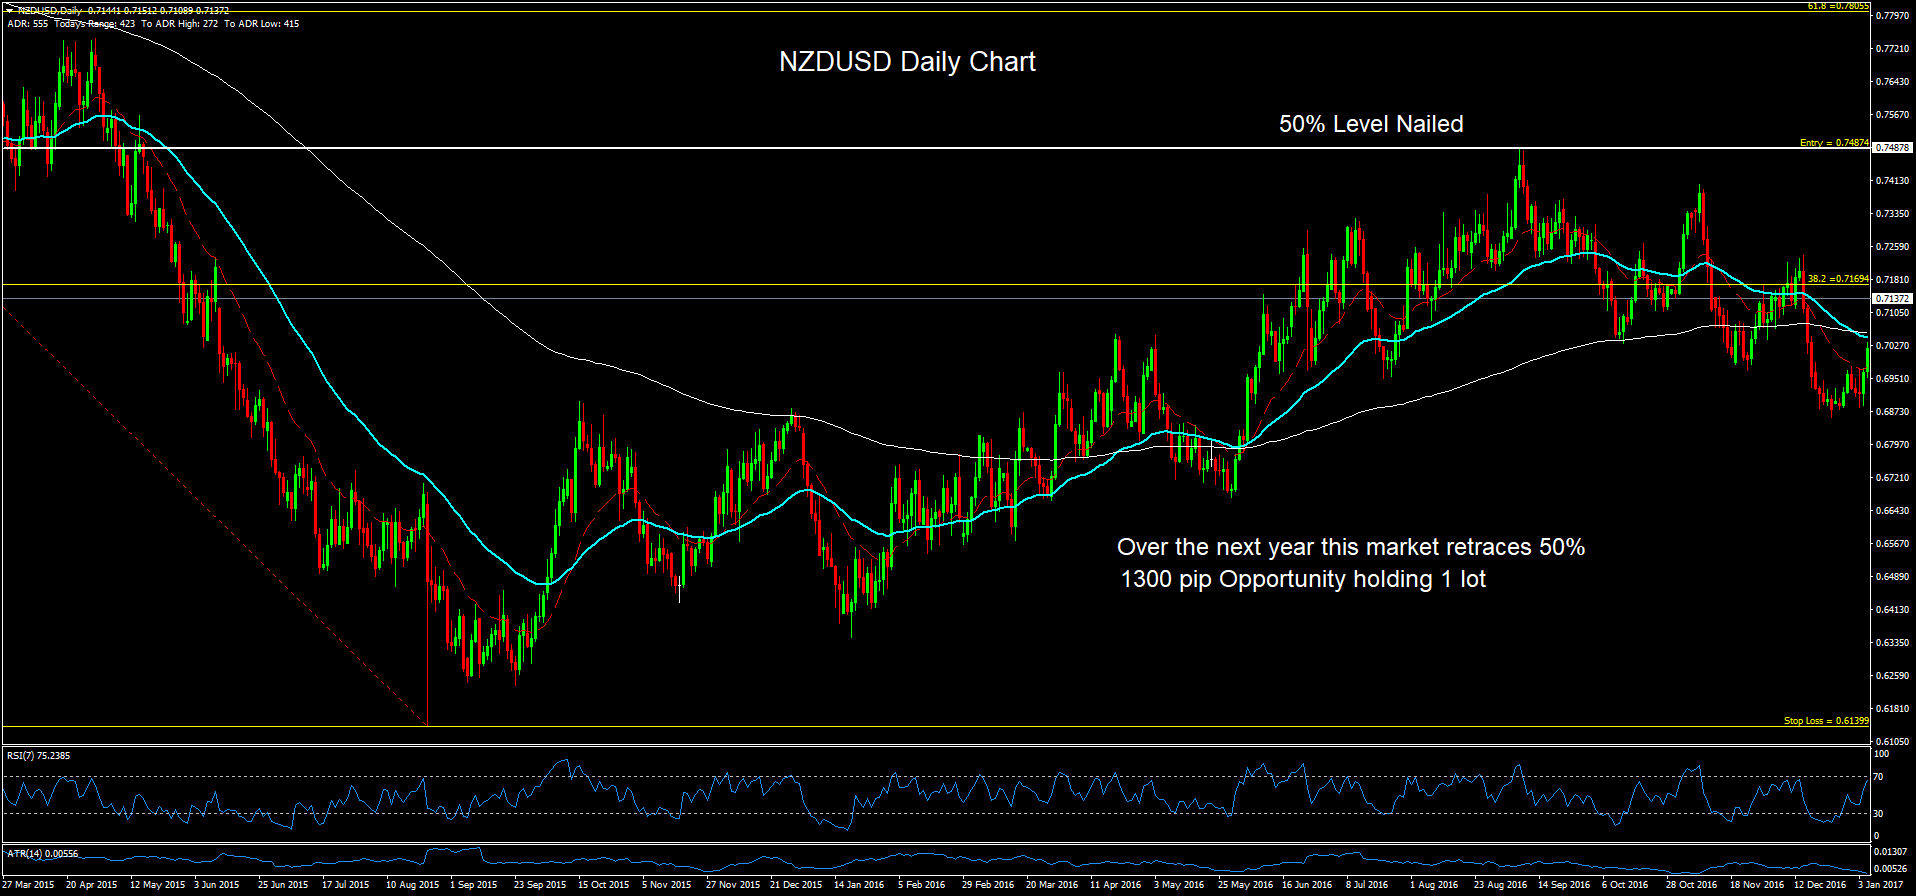
In the following Daily chart example NZDUSD had a strong push down of almost 3,000 pips over a 1 year period. Over this entire move the market didn’t make a 50% retracement. This set up an opportunity to trade this market back to the 50% level. There was 1300 pips from the low to the 50% level. Over the next year this market worked its way back and tagged the 50% level in September.
Trading this opportunity with the TrendBot EA would produce 4-6X the profit made with a simple buy strategy.
Major Patterns
Major Patterns are also good opportunities to run the TrendBot EA as they usually signal major reversals of trend and provide descent targets to aim for. It is always good to have a target so you have an idea of where price is heading and where you will complete the trade.
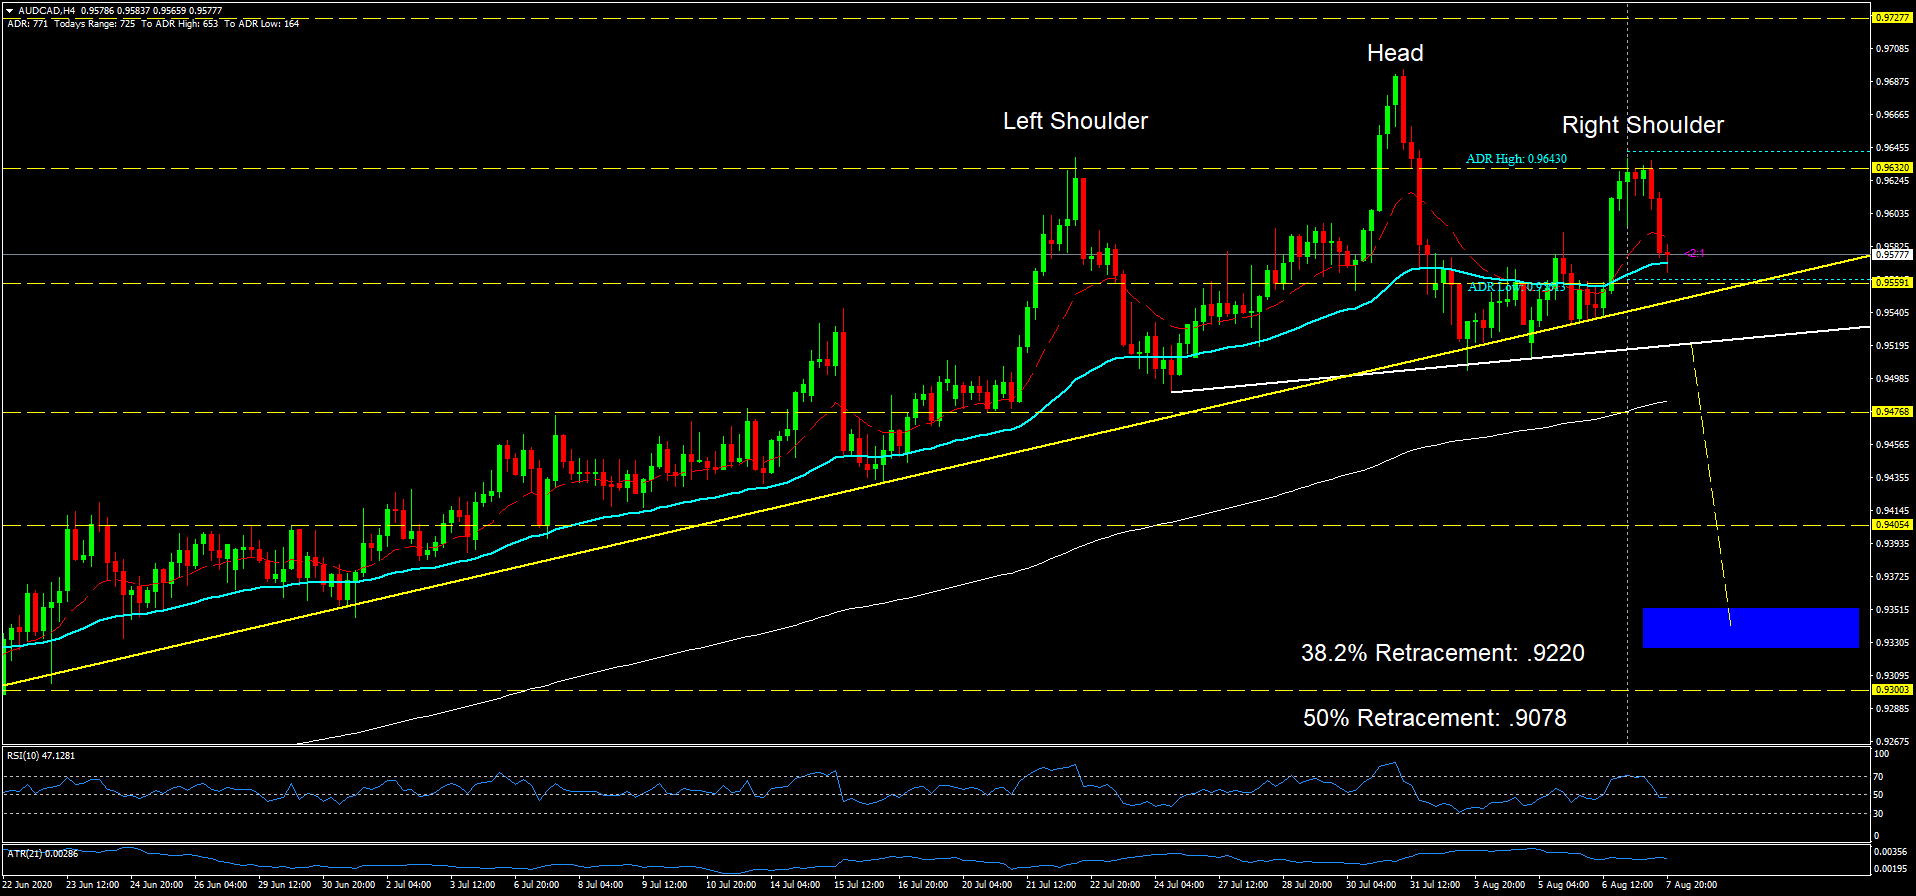
Head & Shoulders Tops & Bottoms
The head & shoulders pattern is the largest reversal pattern and provides good targets. In the example below, the AUDCAD market set up developed a head & shoulders top formation. Targets can be set based on the pattern as well as the Fibonacci retracement levels.
Triangles
There are a variety of triangle patterns that can be traded on the daily, weekly and monthly charts. There are ascending, descending and symmetrical triangles which form and you can learn more about them and other major patterns in our course “Trading Through Technical Analysis”. In the example below, USDCAD formed a descending triangle on the daily chart, and the target was also a daily gap, even better.
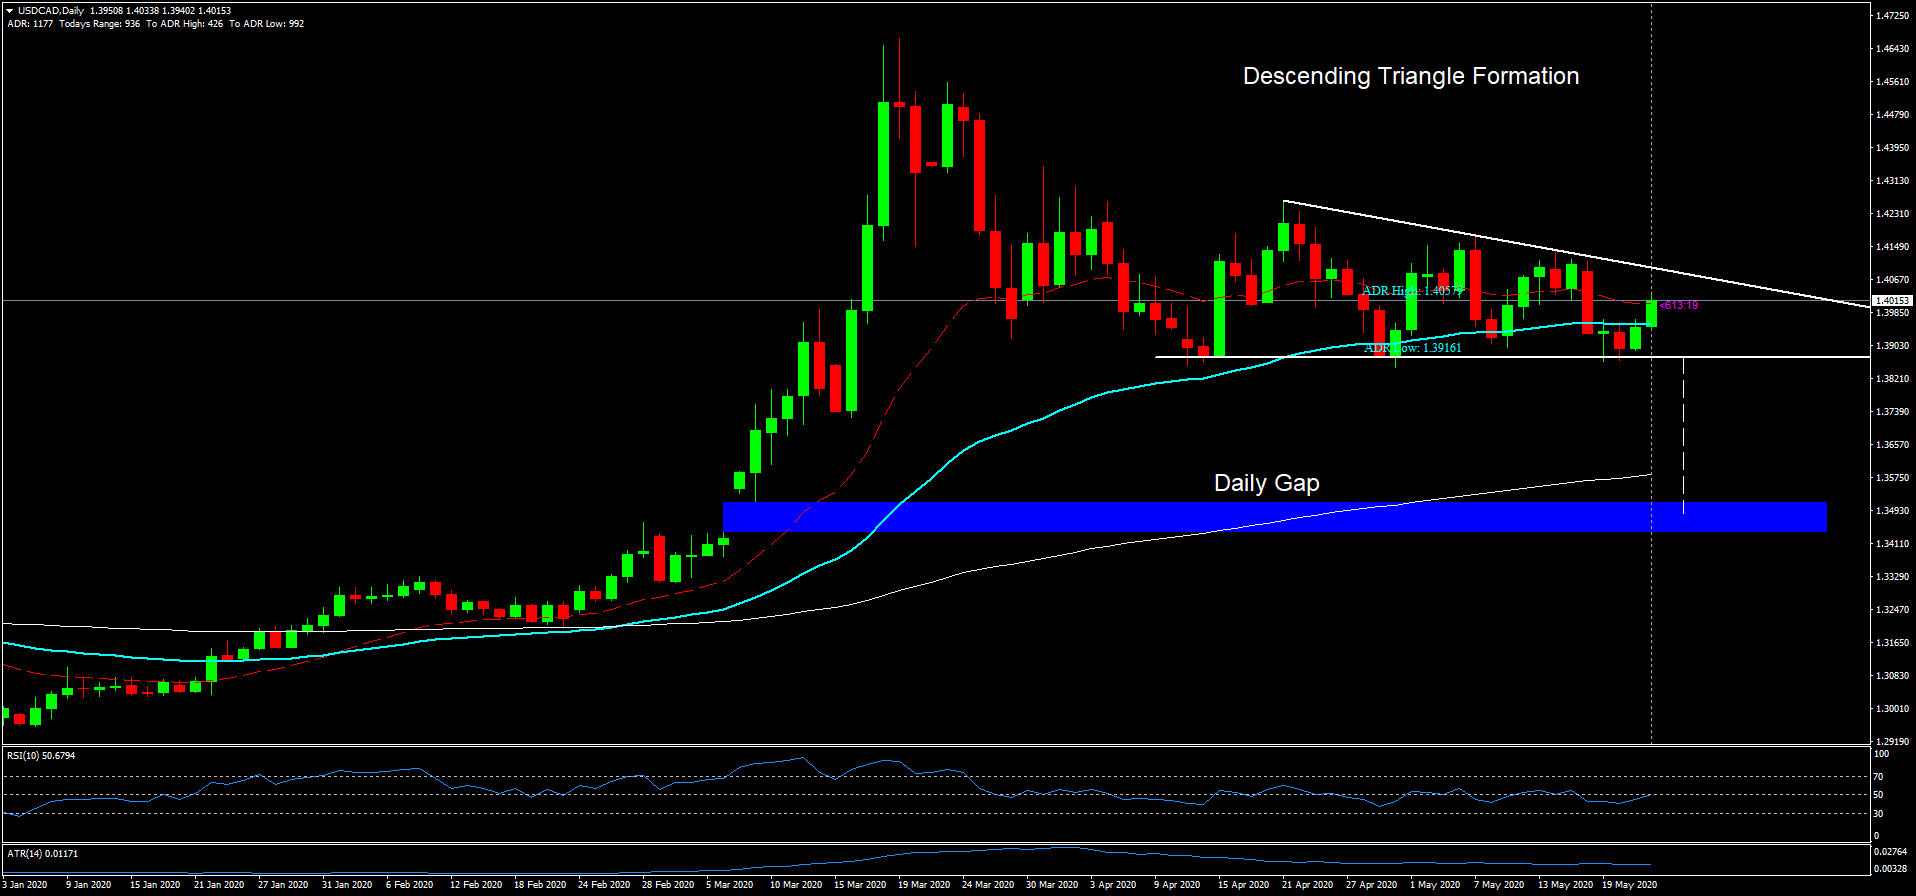
By analyzing the price chart through technical analysis and combining patterns, retracements and extreme price points, the probability of success will be greatly increased. Be aware that entering trades before the patterns complete are more profitable but riskier as well. We will discuss risk management in more detail later in the course.
Fundamentals
Opportunities also come about through fundamental information as well. For example, right now it is December 2020 and we are currently running the TrendBot EA in the Silver market with a target of $40.000, possibly higher. We are buying silver as the US Government is running massive debts, the corona pandemic is still wreaking havoc, and the massive money printing is creating inflation which is set to increase.
The Silver chart below shows what the TrendBot EA does during volatile periods in the market. Volatility is ever increasing and decreasing and really put a trader to the test. As traders we like volatility as it is how we make money, but too much of it and even the most seasoned trader will hesitate. The robot simply continues to follow the plan as it has done throughout this massive Bull Run in Silver. Currently the price is around 25.75 and set to continue into 2021. Each of the arrows is the robot entering trades.
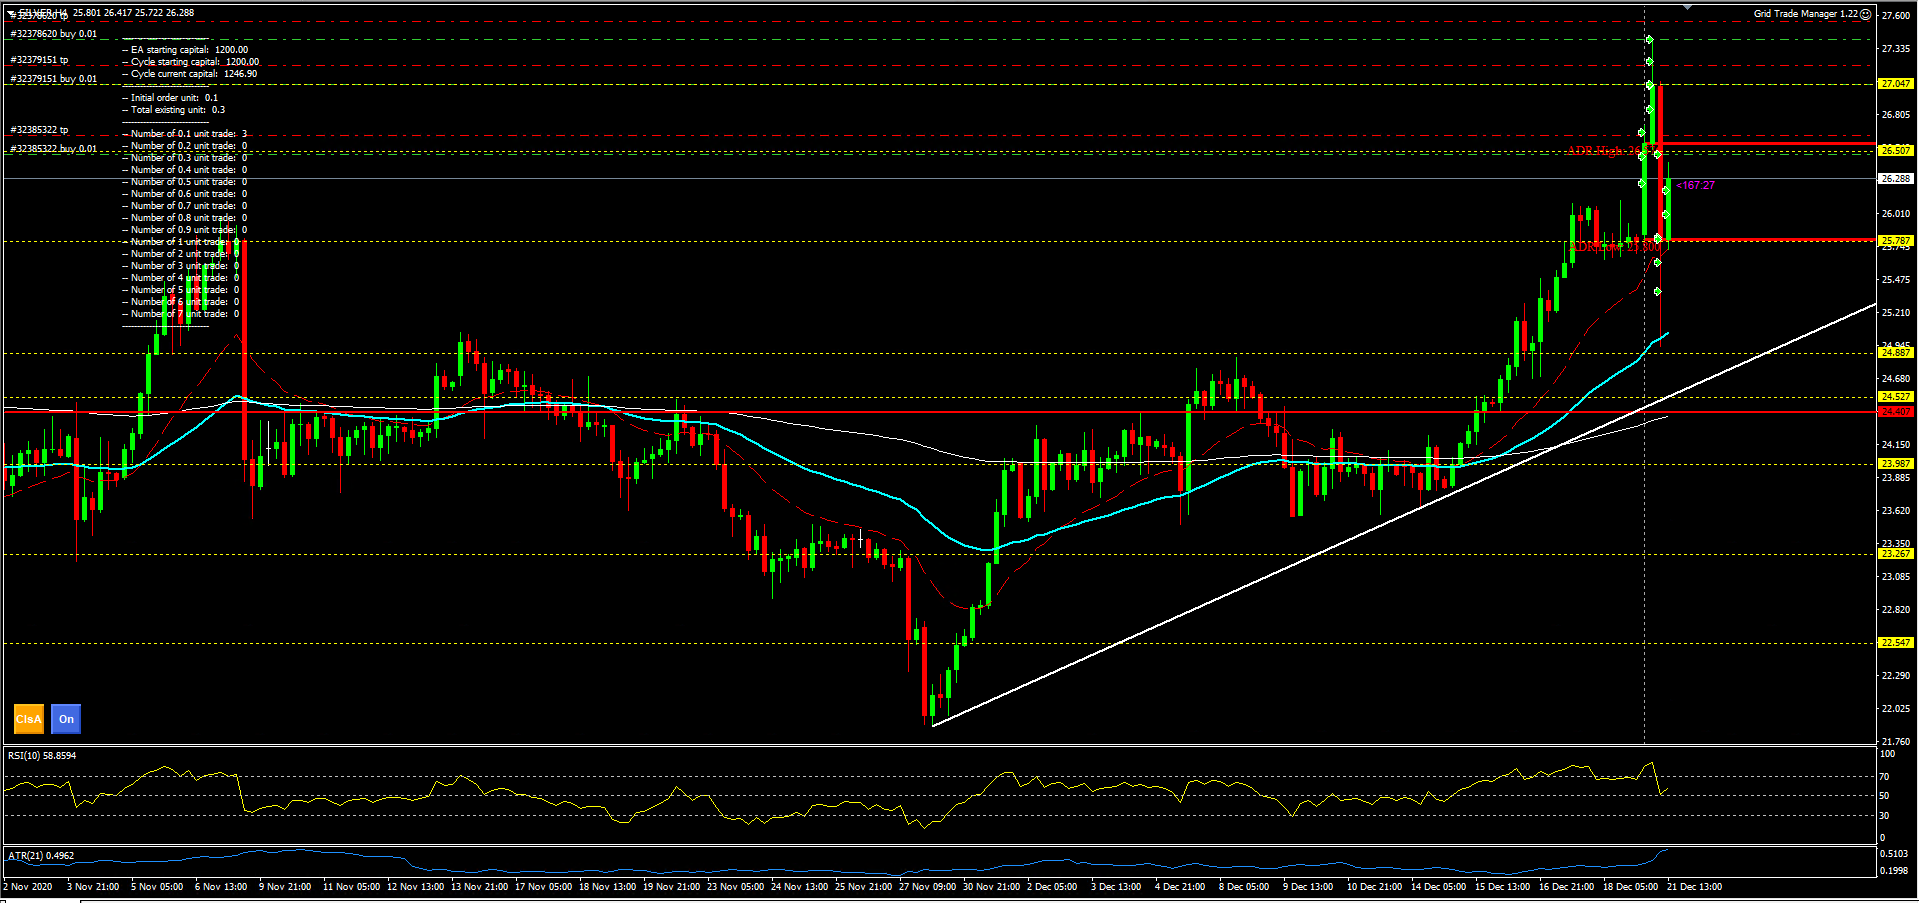
The target isn’t as much the price as sentiment towards the metal. Once it becomes highly talked about on Main Street (non-financial part of society) and the frenzy to get in has begun, it will be time to get out.
Newsweek Magazine
A great source for sentiment is Newsweek. Don’t read the article, simply see what they have on the cover and you will get an idea of what the talk of the town is. Use that information to not trade in the direction of the topic but to be a contrarian and see if there is an opportunity setting up in the opposite direction!
Trader’s Mindset:
Learn to focus on the information that helps you spot opportunities to make a profit, rather than focusing on the information that reinforces your fears. Being prepared and gaining a thorough understanding through experience will help you to overcome your fears and the problem with the way you think.